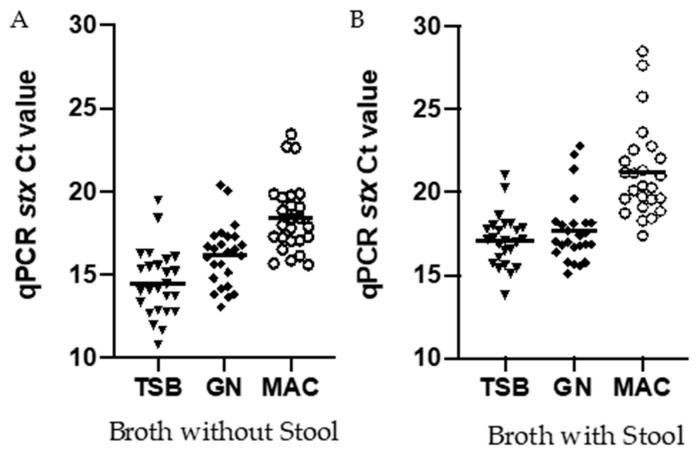
Figure 4.
(A) represent broth without Stool, (B) represent broth with Stool. qPCR Ct values of stx from STEC isolates enriched in tryptic soy broth (TSB), GN, and MacConkey (MAC) with and without stool. DNA was extracted from the STEC enriched broth and qPCR was done. Each symbol represents a single isolate. n = 25 isolates.

