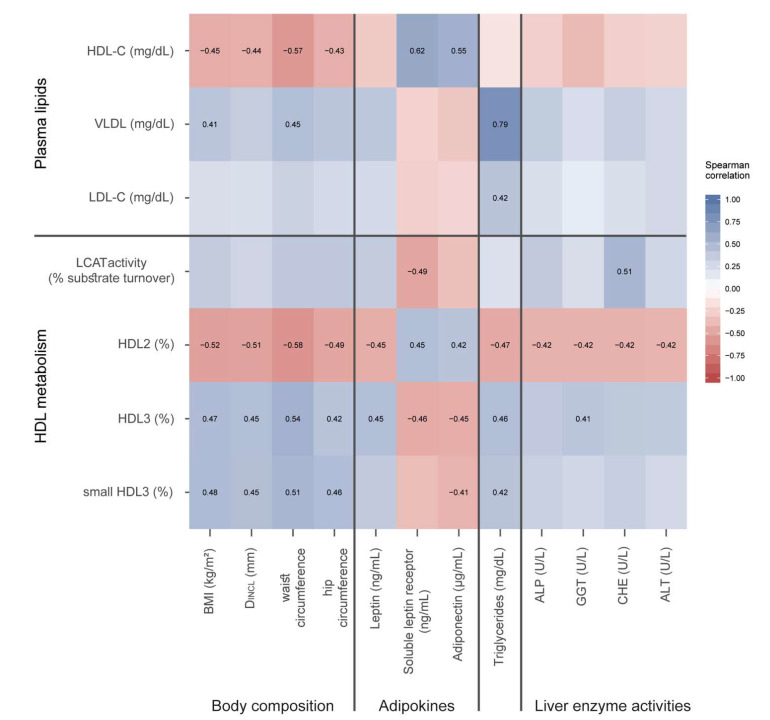
Figure 6.
Correlation between plasma lipid levels and parameters of HDL metabolism with body composition, adipokines, serum triglycerides, and liver enzyme activities. Each cell of the heatmap represents pairwise Spearman correlation between the two parameters indicated in the respective row and column. Correlations that reached significance after Bonferroni correction are indicated with the corresponding Spearman rank correlation coefficient. Non-significant correlations can still be inferred from the color but are not explicitly indicated. HDL-C, high-density lipoprotein cholesterol; VLDL, very low density lipoprotein; LDL-C, low-density lipoprotein cholesterol; LCAT, lecithin cholesteryl acyltransferase; CETP, cholesteryl-ester transfer protein; BMI, body mass index; DINCL thickness of subcutaneous adipose tissue at eight measured body sites; SOB-R, soluble leptin receptor; ALP, alkaline phosphatase; GGT, gamma-glutamyl transpeptidase; CHE, cholinesterase; ALT, alanine transaminase.

