Figure 6.

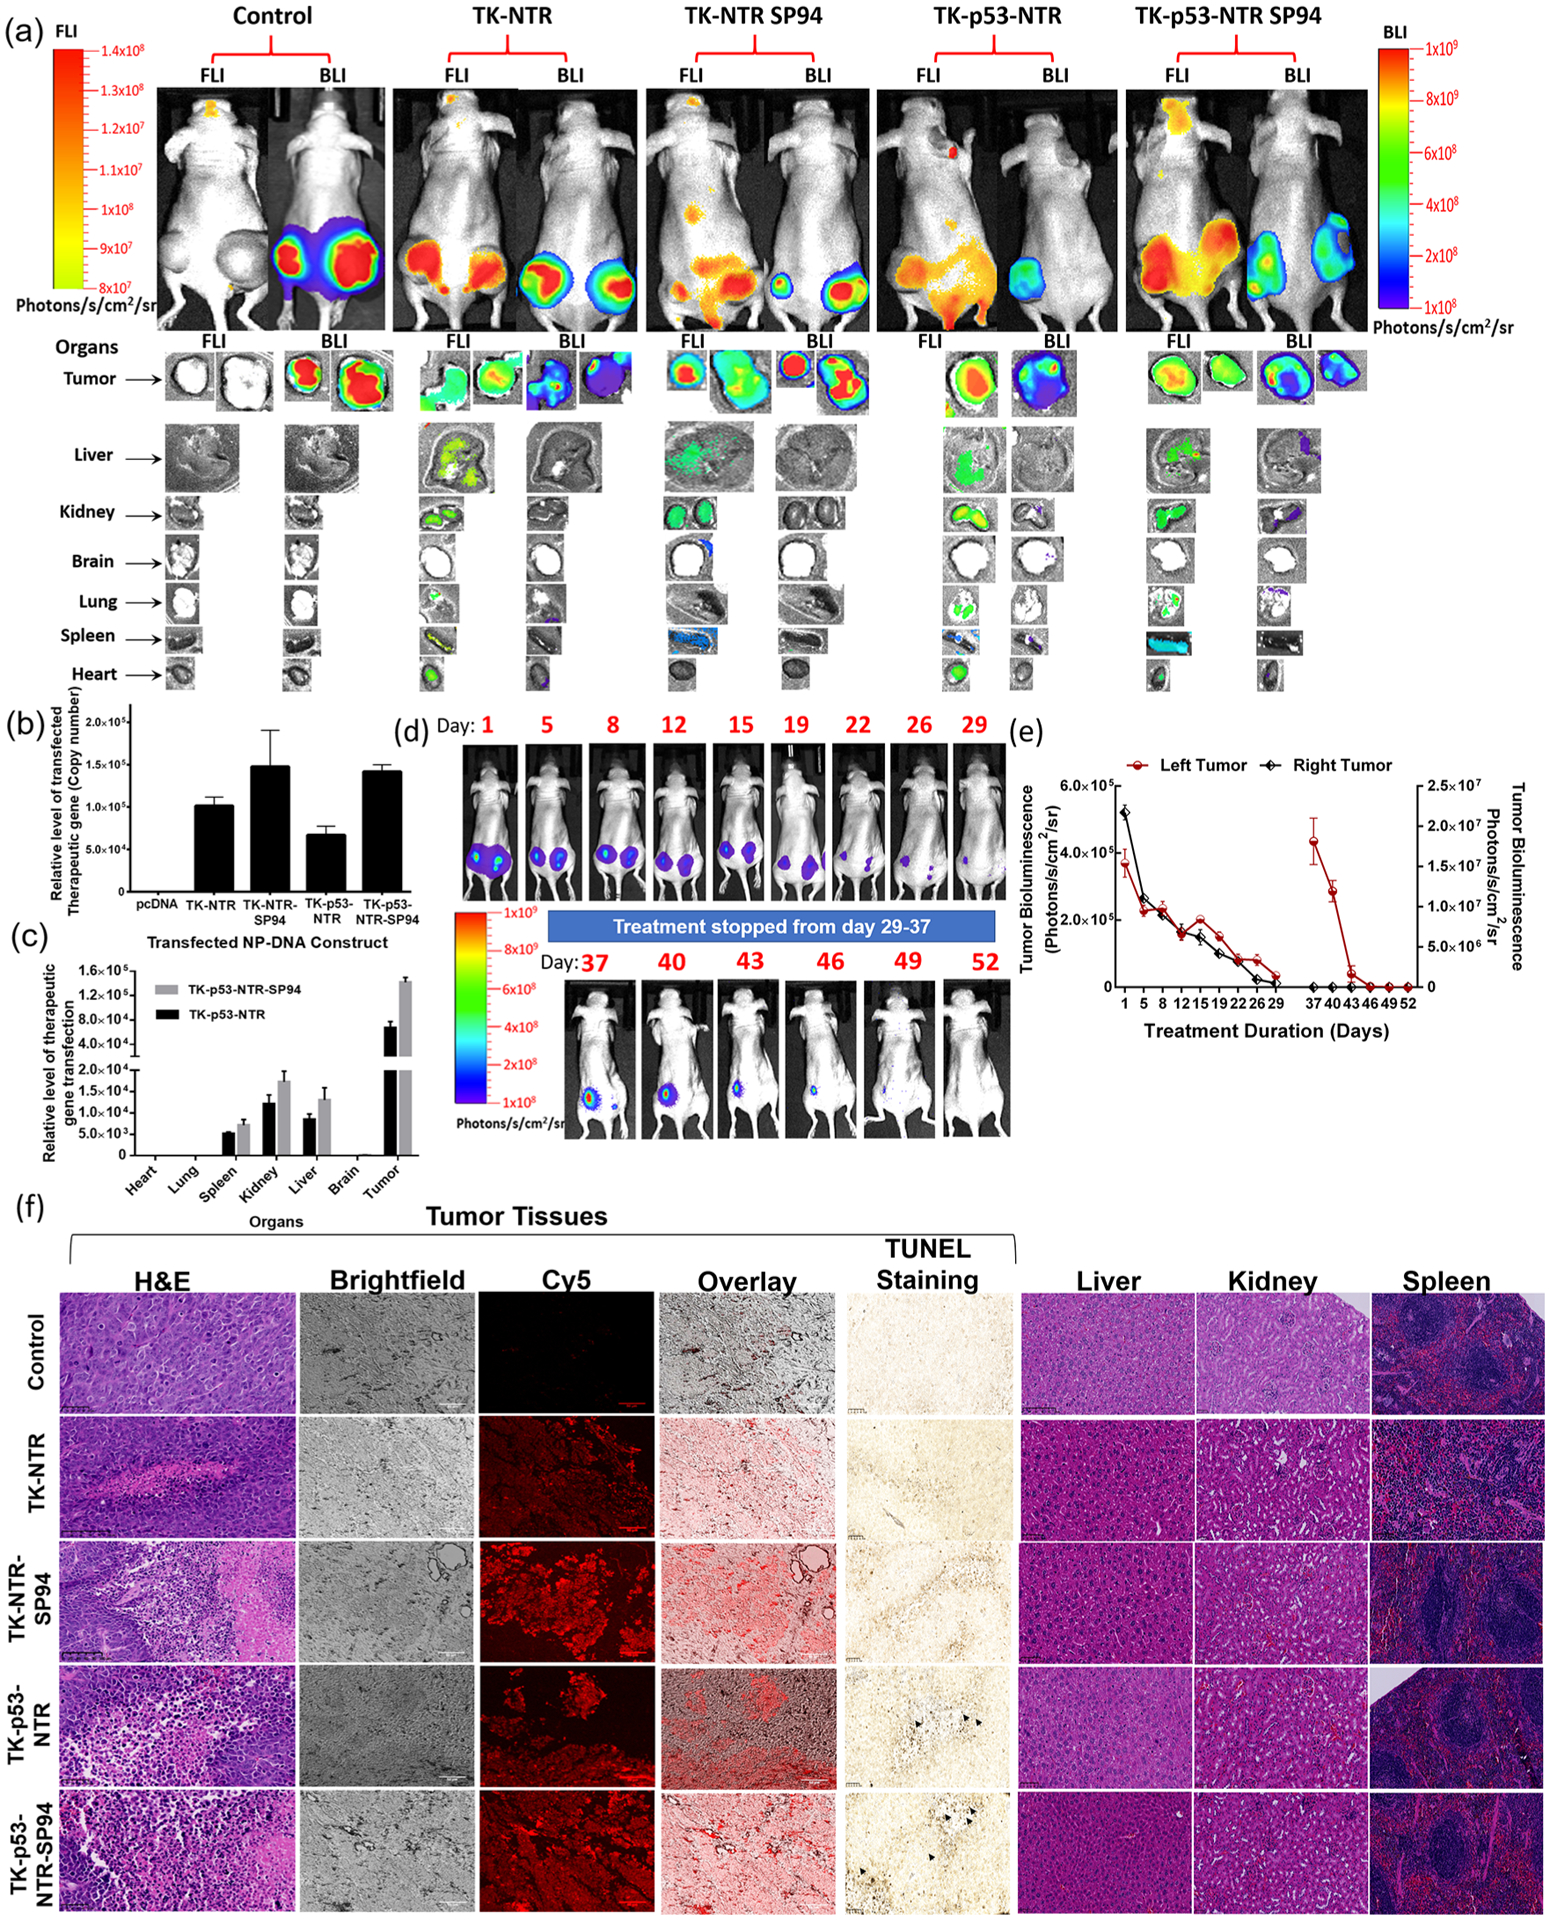
Evaluation of TK–p53–NTR therapeutic gene delivery by PLGA–PEG–PEI nanoparticles, expression in animals by CytoCy5S fluorescence imaging, biodistribution in tumor and other organs by ex vivo imaging and qPCR, and therapeutic response by bioluminescence imaging, ex vivo histology, and terminal deoxynucleotidyl transferase-mediated dUTP nick end-labeling (TUNEL) assay. (a) Bioluminescence (HepG2–Fluc activity) and fluorescence 640/690 (CytoCy5 substrate conversion) images of nude mice in vivo (FLuc: 300 s, BLI: 50 s), and ex vivo (FLuc: 200 s, BLI: 50 s) imaging of tissues harvested after completion of the study. (b) Quantitative estimation of TK–NTR/TK–p53–NTR gene delivery to tumors and their biodistribution in different organs using qPCR analysis (c). (d, e) Evaluation of TK–p53–NTR therapeutic potential in complete eradication of tumor and its enhanced anticancer potential upon tumor relapse using tumor bioluminescence imaging and ROI quantitation plot of tumor BLI signal. The data are presented as mean ± standard error of the mean (SEM); * represents p < 0.05, ** represents p < 0.01, and *** represents p < 0.001. (f) Histologic analysis of tumor sections and organs of different treatment groups by H&E staining, CytoCy5S fluorescence tracking, and TUNEL assay.
