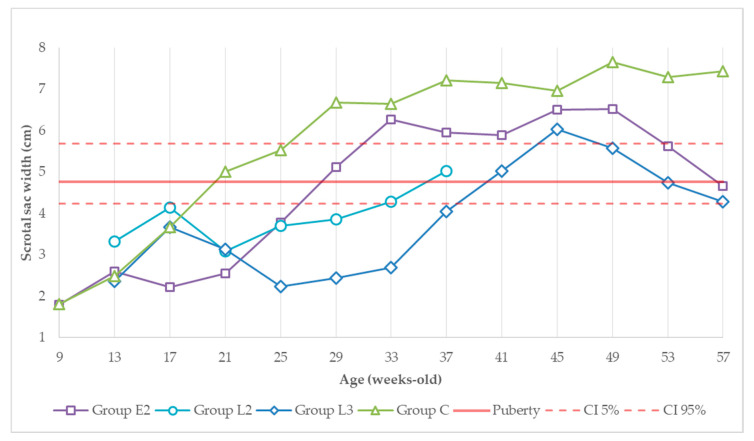
Figure 3.
Evolution of scrotal sac width (cm) over experimental time. Red solid and dashed lines correspond to the predicted testicular width at puberty (95% confidence level) [32]. Dimensions from groups E2 and L3 in the 37th week and from the control group in the 33rd week are estimated.

