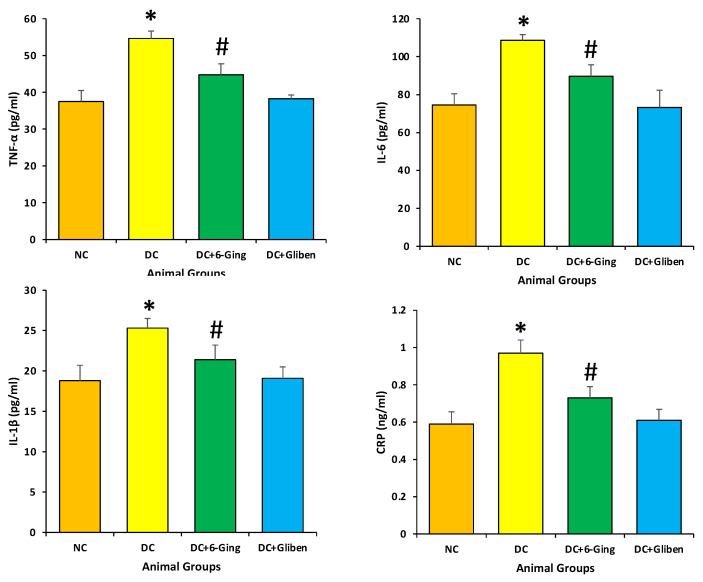
Figure 5.
The inflammatory markers level in different groups of rats after 8 weeks of treatment. The rats were equally divided into 4 groups, each group (sample size = 8). Data are summarized as mean ± standard error of the mean (SEM). Groups: Normal control (NC); disease control (DC), i.e., STZ-treated group; treatment group (DC + 6-gingerol); positive control (PC) animal treated with STZ + glibenclamide; * p < 0.05 (significant difference of final b.w. between DC vs. NC) # p < 0.05 (significant difference of final b.w. between DC vs. DC + 6-gingerol).

