Figure 3.
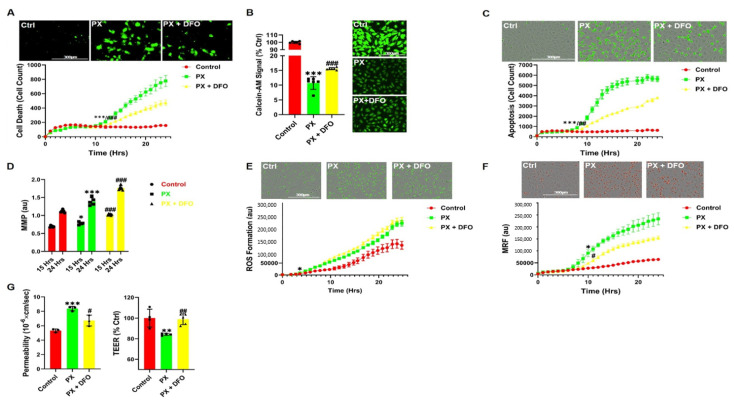
DFO diminishes cell toxicity and rescues barrier functions. (A) Live cell imaging of cell death was examined by cytotoxicity 24 h post 400 µM PX treatment on a BLEC monolayer. DFO was added at 50 µg/mL. Ctrl are cells cultured with normal medium without the addition of any treatments. Mean ± s.d. of one representative experiment is shown, out of five independent experiments with n = 20–30, *** p < 0.001 vs. ctrl and ## p < 0.01 vs. PX marks the first time point with a significant change; (B) Labile iron pool (LIP) was assessed by Calcein-AM on a PX treated BLEC monolayer 1-h post treatment. Its fluorescent signal negatively correlates with LIP. Mean ± s.d. of one representative experiment is shown, out of two independent experiments with n = 10–12, *** p < 0.001 vs. ctrl and ### p < 0.001 vs. PX; (C) Apoptosis was measured with a caspase-3 activated fluorescent marker by live cell imaging 24-h post PX treatment on a BLEC monolayer. Mean ± s.d. of one representative experiment is shown, out of three independent experiments with n = 12–18, *** p < 0.001 vs. ctrl and ## p < 0.01 vs. PX marks the first time point with a significant change; (D) Mitochondrial membrane permeability was evaluated with the use of live imaging by measuring the mitochondrial membrane depolarization with JC-1 staining on a PX treated BLEC monolayer. Mean ± s.d. of one representative experiment is shown, out of three independent experiments with n = 12–18, * p < 0.05 and *** p < 0.001 vs. ctrl and ### p < 0.001 vs. PX; (E) Live cell imaging of cellular ROS formation was measured with CellRox staining on a PX treated BLEC monolayer Mean ± s.d. of one representative experiment is shown, out of three independent experiments with n = 12–18, * p < 0.05 vs. ctrl marks the first time point with a significant change; (F) Live cell imaging of mitochondrial ROS formation was measured with the Mitosox marker on a PX treated BLEC monolayer. Mean ± s.d. of one representative experiment is shown, out of four independent experiments with n = 16-24, * p < 0. 05 vs. ctrl and # p < 0.05 vs. PX marks the first time point with a significant change; (G) Permeability of sodium fluorescein (NaF) and TEER were measured across the BBB in vitro model (from luminal to abluminal side) 24-h post PX treatment. PX was added at 900 µM and DFO added at 50 µg/mL. Mean ± s.d. of one representative experiment is shown, out of three independent experiments with n = 12–15, *** p < 0.001 and ** p < 0.01 vs. ctrl and # p < 0.05 and ## p < 0.01 vs. PX. Ctrl, control; PX, paraoxon; DFO, Desferal; MRF, mitochondrial ROS formation; MMP, mitochondrial membrane permeability; au, arbitrary units; TEER, Trans endothelial electrical resistance.

