Figure 3.

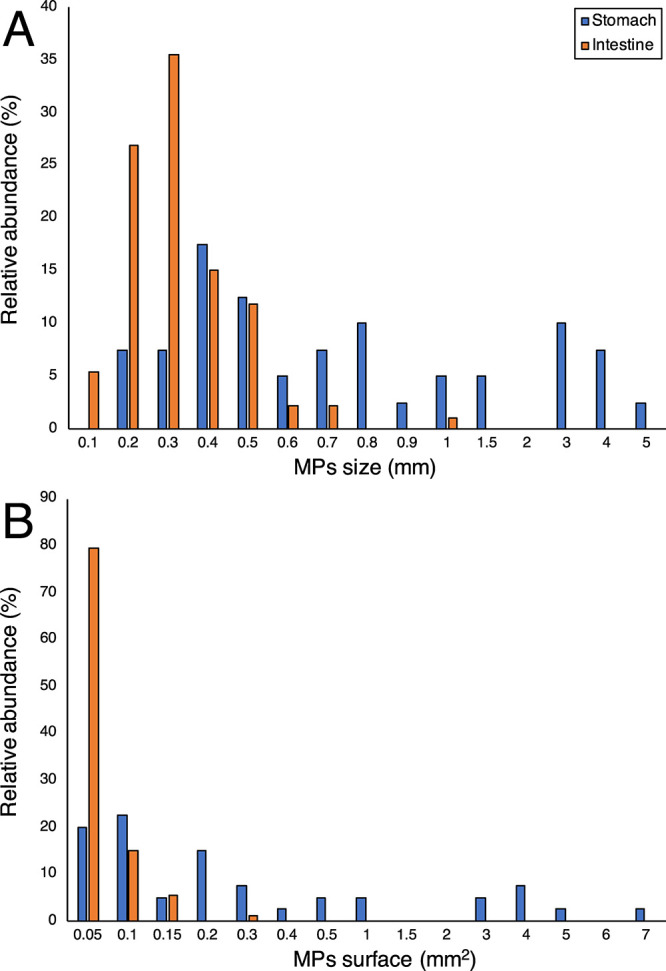
Percentage distributions of (A) MP size (maximum length, in mm) and (B) surface (in mm2) isolated from stomachs and intestines in N. norvegicus.

Percentage distributions of (A) MP size (maximum length, in mm) and (B) surface (in mm2) isolated from stomachs and intestines in N. norvegicus.