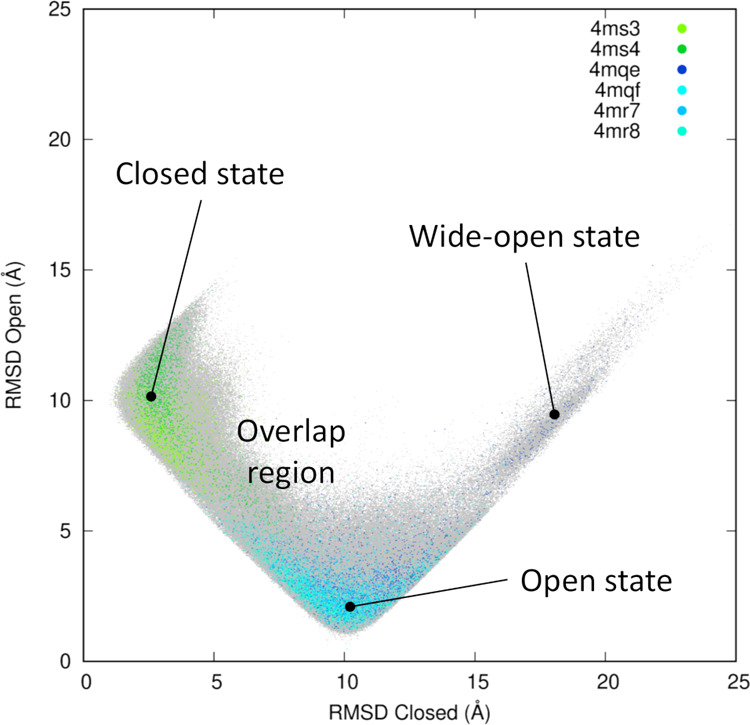
Figure 3.

Projection of the six 1 μs long trajectories onto the two-dimensional (2D)-RMSD space. The profile is calculated using PDB ID 4MS4 and 4MQE as references for the closed and open states, respectively. The entire set of data points is shown as gray dots and the projection of individual trajectories are plotted with a greater stride. The color code is consistent with the legend inside the plot and used throughout this work (green for the closed state and blue for the open state).
