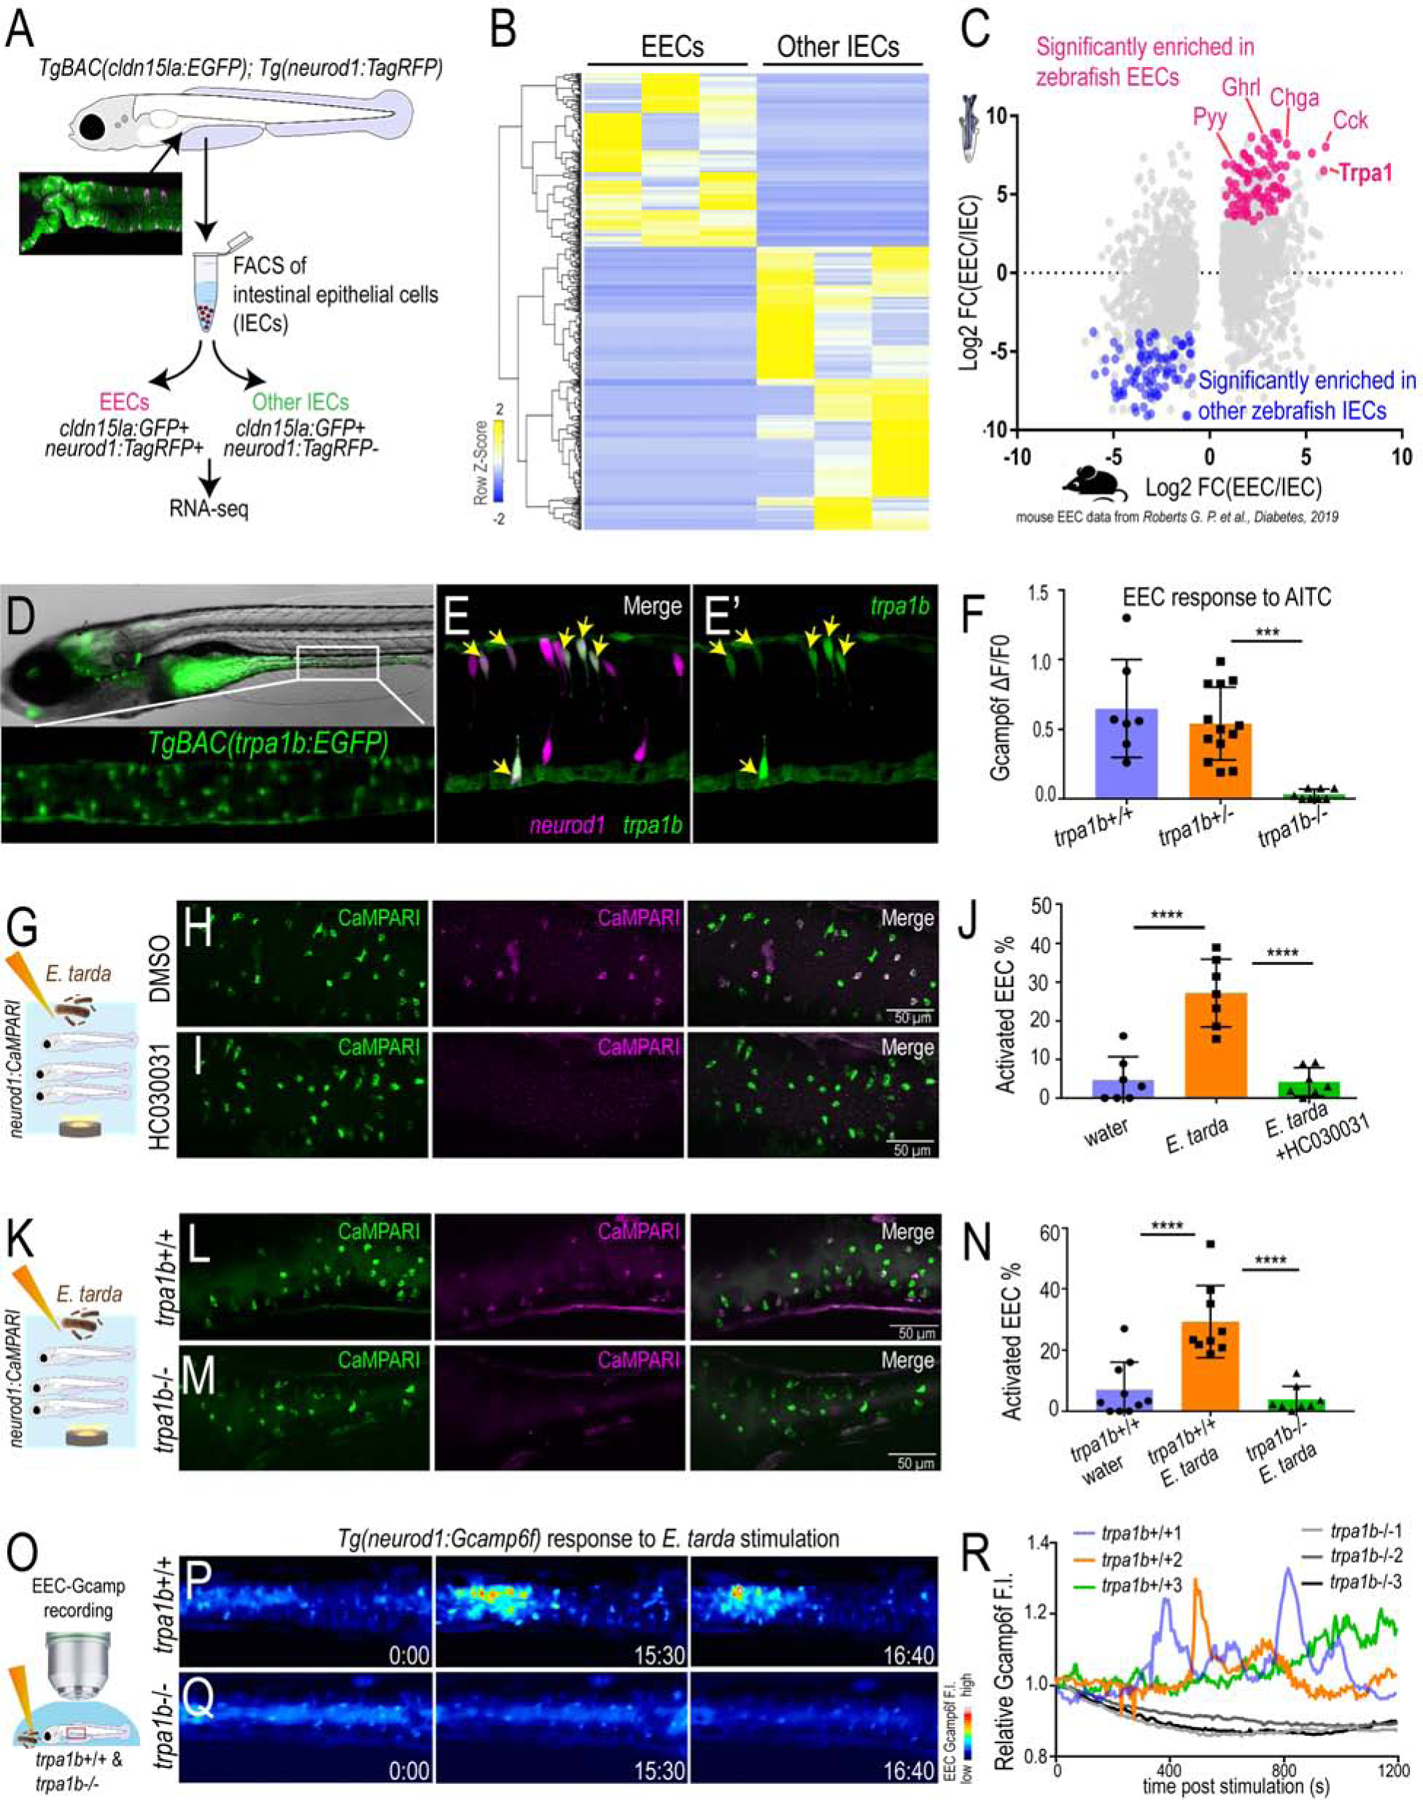
Figure 2. E. tarda activates EECs through Trpa1.

(A) Schematic diagram of zebrafish EEC RNA-seq. (B) Clustering of genes that are significantly enriched in zebrafish EECs and other IECs (Padj<0.05). (C) Comparison of zebrafish and mouse EEC enriched genes. Mouse EEC RNA-seq data was obtained from GSE114913 (Roberts et al., 2019). (D) Fluorescence image of TgBAC(trpa1b:EGFP)(Pan et al., 2012). Zoom-in view shows the expression of trpa1b+ cells in intestine. (E) Confocal projection of a TgBAC(trpa1b:EGFP);Tg(neurod1:TagRFP) zebrafish intestine. Yellow arrows indicate zebrafish EECs that are trpa1b:EGFP+. (F) Quantification of EEC Gcamp responses to Trpa1 agonist AITC stimulation in trpa1b+/+, trpa1b+/− and trpa1b−/− zebrafish. (G) Experimental design. (H-I) Confocal projection of Tg(neurod1:CaMPARI) zebrafish intestine stimulated with E. tarda with or without the Trpa1 antagonist HC030031. (J) Quantification of activated EECs in control and HC030031 treated zebrafish treated with water or E. tarda. (K) Experimental approach. (L-M) Confocal projection of trpa1b+/+ or trpa1b−/− Tg(neurod1:CaMPARI) intestine after stimulation with water or E. tarda. (N) Quantification of activated EEC percentage in WT and trpa1b−/− zebrafish treated with water or E. tarda. (O) Experimental design. (P-Q) Timed images of trpa1b+/+ or trpa1b−/− Tg(neurod1:Gcamp6f) zebrafish stimulated with E. tarda. (R) Quantification of relative EEC Gcamp6f fluorescence intensity in WT or trpa1b−/− zebrafish treated with E. tarda. One-way ANOVA with Tukey’s posttest was used in F, J, N. *p<0.05; **p<0.01; ***p<0.001; ****p<0.0001.
