Figure 4.
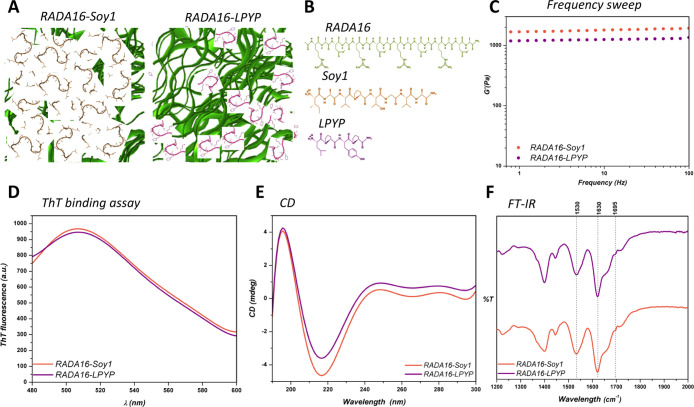
Characterization of SAP nanogels. (A) Cartoon representation and (B) chemical structures of RADA16, RADA16-Soy1, and RADA16-LPYP nanogels. (C) Biomechanical characterization of RADA16-Soy1 and RADA16-LPYP nanogels via a frequency sweep test (0.1–100 Hz, 1% strain). (D) ThT emission spectra of RADA16-Soy1 and RADA16-LPYP nanogels: their affinity for ThT may be ascribable to the presence of cross-β fibril structures. (E) CD spectrum of RADA16-Soy1 and RADA16-LPYP in solution showing the presence of β-sheet assemblies. (F) FTIR analysis of RADA16-Soy and RADA16-LPYP with peaks at ∼1630 and ∼1695 cm–1 (amide I region) and 1530 cm–1 (amide II region) typically associated with β-sheet signatures.

