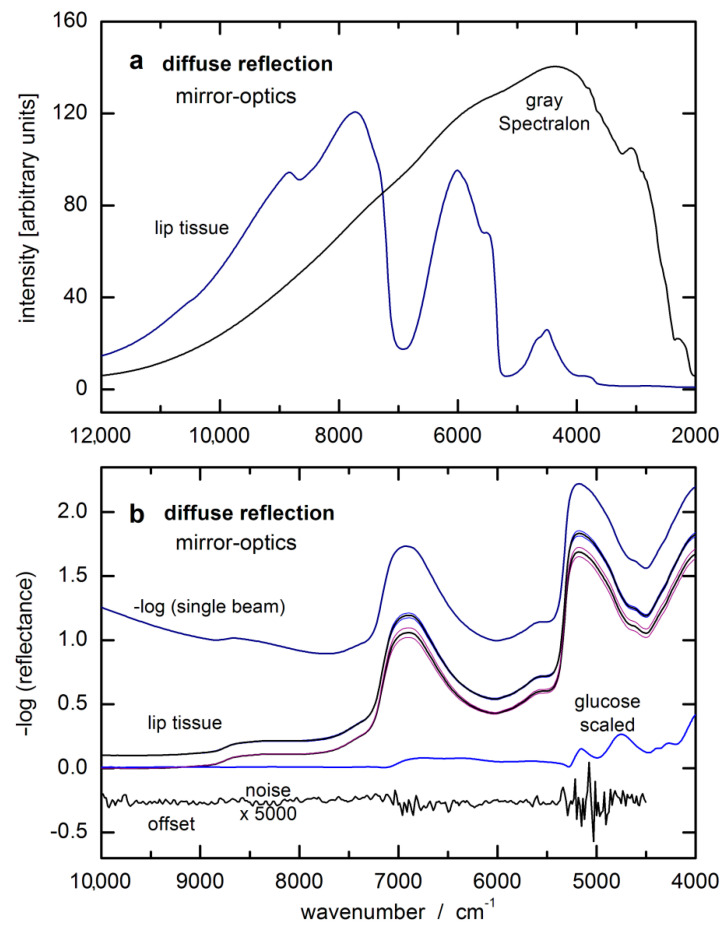
Figure 3.
(a) Single-beam spectra of oral mucosa and a gray reflectance standard of 5% reflectivity, measured by diffuse reflection; (b) log-converted single-beam lip spectrum and two lip reflectance spectra as calculated from two respective series of five consecutively recorded lip tissue spectra shown as average spectra with according standard deviation spectra (spectra were taken at the beginning of our two-day measurements with capillary blood glucose values around 50 mg/dL and around 400 mg/dL during the first day; all spectra were offset for better visualization) and enlarged noise spectrum from two consecutive lip measurements after baseline correction.

