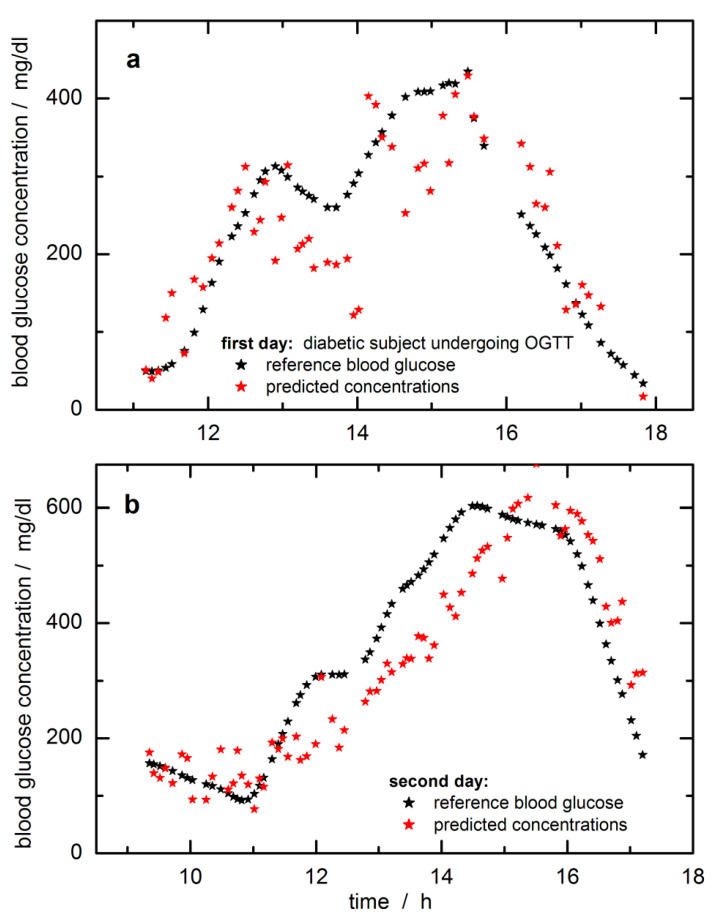
Figure 6.
Predictions of tissue glucose concentrations versus blood glucose values for the first day (a) and the second day of the modified oral glucose tolerance test (OGTT) (b); tissue concentrations were calculated with the SBC-calibration model using reflection lip spectra and glucose absorptivities scaled with photon penetration depth (results were offset corrected, see also text). Spectra and reference blood glucose concentration data are from previous publications [31,33]; calibration interval was from 8994–5477 cm−1 (115 data points) with noise covariance calculated from differences of lip spectra less than 8 min apart.

