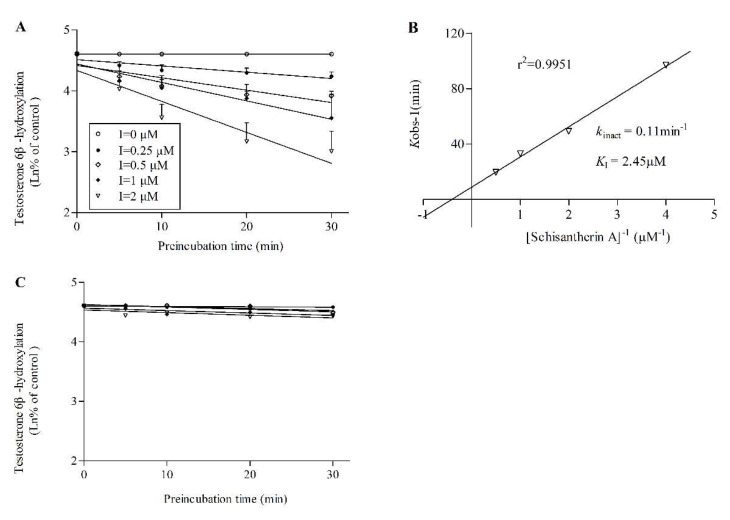
Figure 3.
Inactivation of CYP3A4 (A,B) and CYP3A5(C) activity by STA. Various concentrations of STA (0, 0.25, 0.5, 1, 2 μM) and NADPH (Nicotinamide Adenine Dinucleotide Phosphate) at were preincubated at 37 °C for 0, 5, 10, 20 and 30 min in 0.1 M phosphate buffer solution (PBS). (A,C) a plot of the log of percentage of control activity versus pre-incubation time. (B) a plot of the half-life of enzyme inactivation versus the inverse of the STA concentration. Each point represents the average of triplicate experiments (mean and SD values are listed in Table S1).

