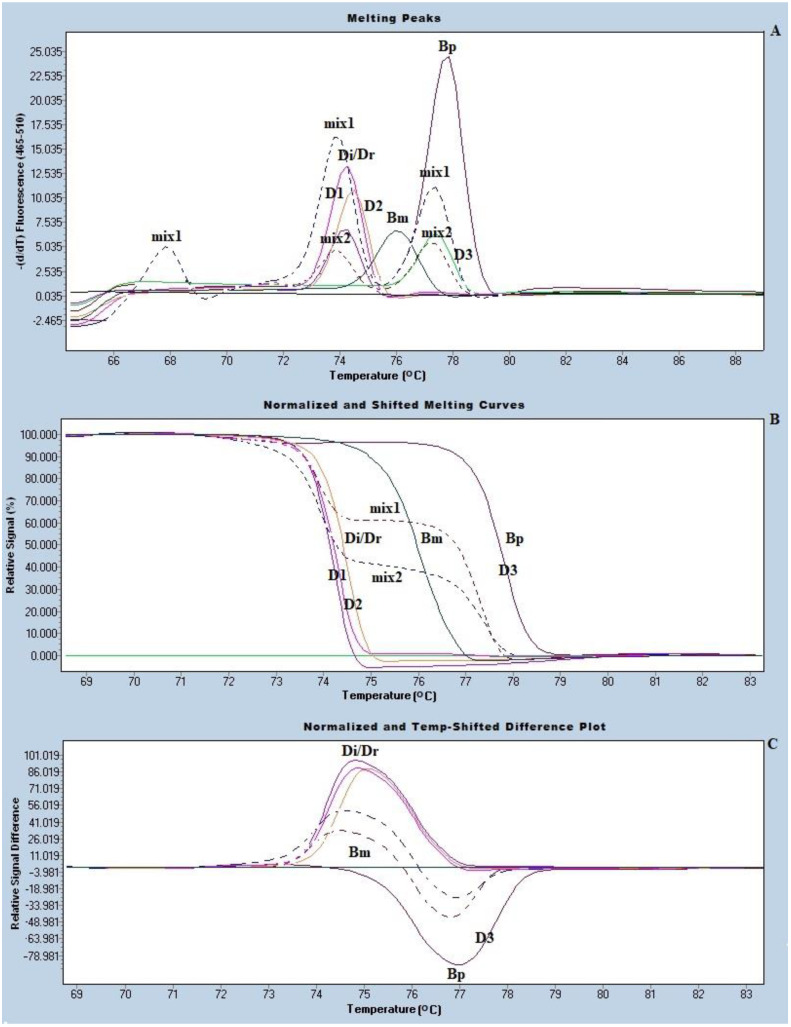
Figure 3.
The real time PCR with High Resolution Melting (HRM) analysis for species identification of the trapped mf, (A) melting peaks, (B) normalized difference curves, and (C) the normalized and temperature shifted difference plot of the amplified product of a positive control, i.e., B. malayi, B. pahangi, and D immitis/D. repens and the mf positive dog samples. D1−3 representative DNAs from 119 microfilaria-positive dog blood samples. mix1 and mix2 represented mix infections (represented with a dot line).

