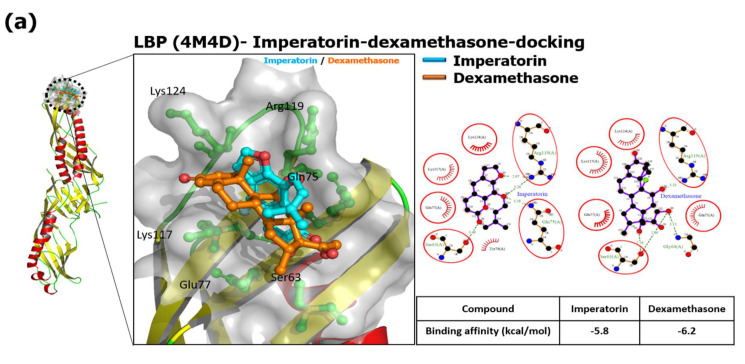
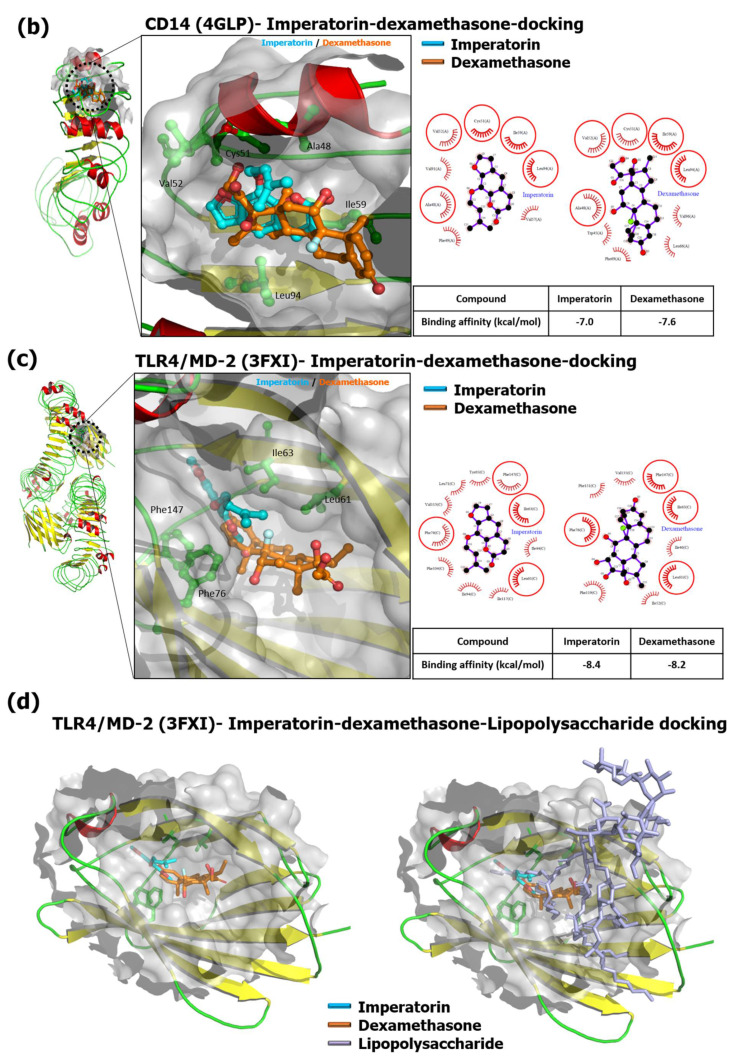
Figure 1.
IMP interfered with the LBP, CD14, and MD-2, in TLR4 co-receptor complex with the computational protein–ligand docking model. The binding pocket side is a surface model, and the inhibitor is a ball and stick model. Red or pink eyebrow-like icons illustrate hydrophobic interactions. The green dash line indicates the hydrogen bonds pairing with each other. The red circles identify the residue on each plot that is equivalent. The best binding affinities between IMP and Dexa to LBP are shown below. LPS is a gray color. IMP is a light blue color. Dexa is an orange color. (a) LBP binding with IMP and Dexa (superimposition). The LigPlot+ 2D diagrams show the potential intermolecular interactions in IMP/LBP and Dexa/LBP. (b) CD14 binding with IMP and Dexa (superimposition). The LigPlot+ 2D diagrams of the potential intermolecular interactions in IMP/CD14 and Dexa/CD14. The best binding affinities of IMP and Dexa were in the binding of CD14. (c) TLR4/MD-2 binding with IMP and Dexa (superimposition). The LigPlot+ 2D diagrams of the potential intermolecular interactions in IMP/MD-2 and Dexa/MD2. (d) Structures of IMP or Dexa bound to MD-2 influence the LPS binding to the TLR4/MD-2 co-receptor complex.


