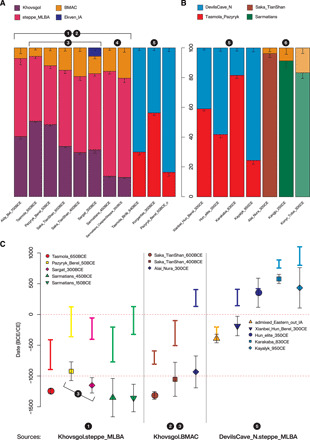
Fig. 3. Bar plots showing the ancestry proportions and SEs obtained from qpWave/qpAdm modelings.

(A) Fitting models for the main IA groups using LBA sources, the major genetic shift with the “new” East Asian influx (DevilsCave_N-like) observed in the Middle IA outliers and Korgantas. (B) Fitting models for the post-IA groups using IA groups as sources. A transparency factor is added to the models presenting poor fits (P < 0.05; only Konyr_Tobe_300CE). On the top is shown the color legend for the sources tested. (C) Summary of the admixture dates obtained with DATES for the main groups studied. The y axis is the temporal scale from BCE (negative) to CE (positive) dates. The x axis represents the results for the different target groups reported in the legends in each box using the two-way sources reported at the bottom of the three panels formed along the x axis (e.g., source1 + source2). The colored bars represent the date ranges of the culture, while the filled symbols show the admixture dates ± SEs obtained from DATES and converted into dates considering 29 years per generation starting from the median point of the culture’s age. The three set of sources reported correspond to the summary of the main admixture events described in the text from left to right: the LBA formation of the Scythian gene pools; the BMAC-related influx increasing through time in the Tian Shan Sakas; and the new eastern influx starting in the IA and continuing throughout the centuries. A number-based key (the white numbers from 1 to 6 inside the black circles) connects different tests and analyses shown in the figure with the corresponding arrow in Fig. 4.
