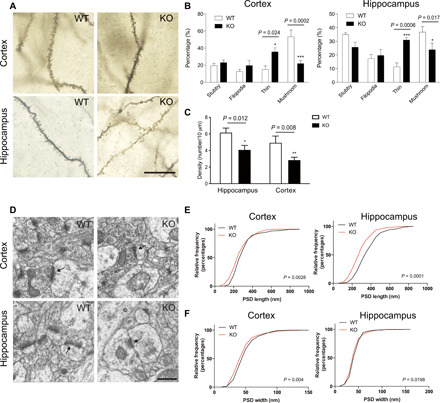
Fig. 4. Impaired synaptic morphology in cortex and hippocampus of Ftsj1 KO mouse brain.

(A) Representative Golgi staining of cortical and hippocampal neurons from 8-week-old Ftsj1 WT and KO mice. Scale bar, 20 μm. (B) Quantitative analysis of dendritic spine morphology. Data were from 128 WT cortical spines, 169 WT hippocampal spines, 169 KO cortical spines, and 118 KO hippocampal spines of three mice for each genotype. Cortical spines: *P = 0.023 and ***P = 0.0002 by two-way analysis of variance (ANOVA) followed by Bonferroni post hoc test. Hippocampal spines: *P = 0.017 and ***P = 0.0006 by two-way ANOVA followed by Bonferroni post hoc test. Error bars present SEM. (C) Density of cortical and hippocampal spines in WT and KO mouse brains. Data were from 235 spines and 366-μm dendrite in WT hippocampal neurons, 159 spines and 388-μm dendrite in KO hippocampal neurons, 163 spines and 456-μm dendrite in WT cortical neurons, and 190 spines and 703-μm dendrite in KO cortical neurons. Three mice were used for each genotype. *P = 0.012 and **P = 0.008 by two-way ANOVA followed by Bonferroni post hoc test. Error bars present SEM. (D) Representative electron microscopic images of cortical and hippocampal PSD (arrows). Scale bar, 500 nm. (E and F) Cumulative frequency distribution of length (E) and width (F) of PSDs from cortex and hippocampus of WT and KO mouse brains. Data were from 240 WT cortical PSD, 251 KO cortical PSD, 253 WT hippocampal PSD, and 270 KO hippocampal PSD of three mice for each genotype. The statistical difference between WT and KO shown in the graphs was analyzed by Mann-Whitney test.
