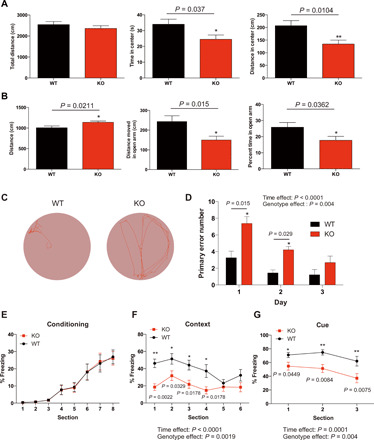
Fig. 6. Ftsj1 KO mouse display behavioral abnormalities.

(A) WT and KO mice were subjected to open-field test. Total distance traveled (left), time spent in the center (middle), and distance traveled in the center (right) are shown. Statistical significance was analyzed by Mann-Whitney test. n = 10 for WT and n = 11 for KO. (B) WT and KO mice were subjected to an elevated plus maze test. Total distance traveled (left), distance traveled in open arm (middle), and time spent in the open arm (right) are shown. n = 20 for WT and n = 22 for KO. Statistical significance was analyzed by Mann-Whitney test. (C) Representative movement during goal seeking behavior of WT and KO mice in a Barnes maze task. The tracking data show that a KO mouse could not efficiently find the goal compared to a WT mouse. (D) Ftsj1 KO mice made significantly more errors in finding the goal than WT mice. n = 18 for WT and n = 16 for KO. Statistical significance was analyzed by two-way ANOVA followed by Holm-Sidak post hoc test. (E to G) WT and KO mice were subject to a fear conditioning paradigm. Percentage of freezing behavior during conditioning period did not differ between WT and KO (E). Ftsj1 KO mice showed significantly less contextual (F) and cued (G) fear behavior than WT. n = 18 for WT and n = 20 for KO. Statistical significance was analyzed by repeated-measures, two-way ANOVA followed by Holm-Sidak post hoc test. Error bars represent SEM.
