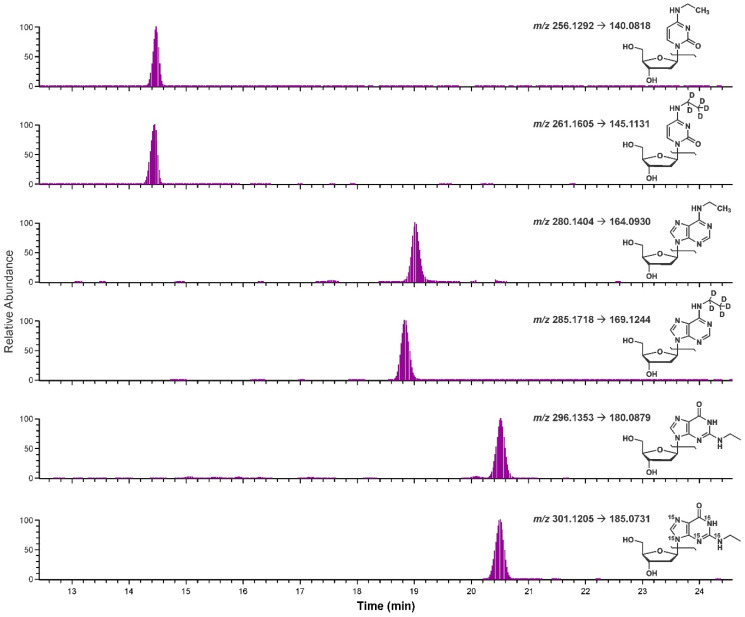
Figure 3.
Chromatograms resulting from co-injection of standards with the CT-DNA sample exposed to 5 mmol acetaldehyde. From the top, N4-ethyl-dC (m/z 256.1292), [D5]N4-ethyl-dC (m/z 261.1605), N6-ethyl-dA (m/z 280.1404), [D5]N6-ethyl-dA (m/z 285.1718), N2-ethyl-dG (m/z 296.1353), and [15N5]N2-ethyl-dG (m/z 301.1205).

