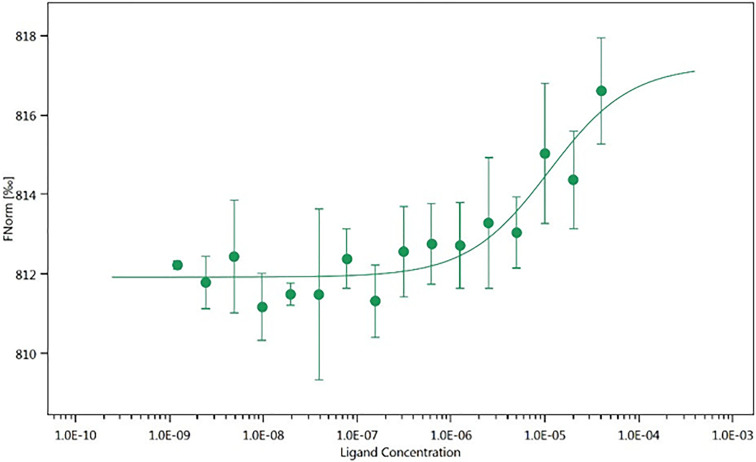
Figure 5.
MST analysis of His-hRAD51-35d binding. Titration curve of (RED-tris-NTA 2nd Generation)-His-hRAD51 (80 nM) with increasing concentrations of 35d. Sigmoidal fitting curve was obtained using the Affinity Analysis software of NanoTemper Technologies. MST data are the average of three replicates.

