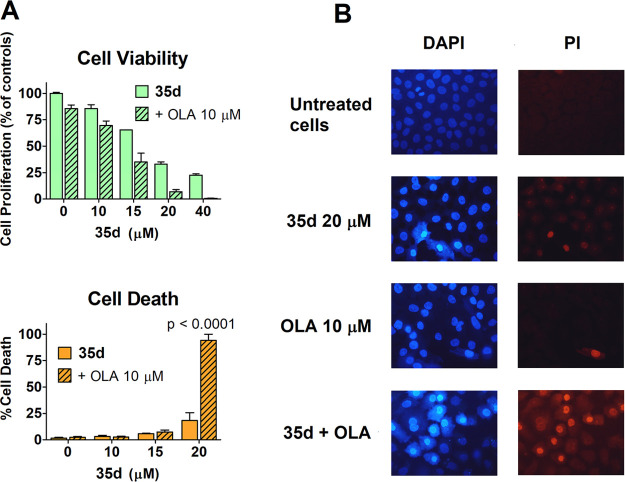
Figure 8.
(A) BxPC3 cell viability and death measured after 72 h exposure to 35d and 10 μM olaparib, given alone or in combination. Data were analyzed by two-way ANOVA using the two treatments (35d and olaparib) as variables. In the cell viability experiment, Bonferroni post-test indicated a statistically significant difference produced by olaparib coadministration in all BxPC3 cultures treated with the different 35d doses, with p values ranging from 0.01 (10 μM 35d) to 0.0001 (15 and 20 μM 35d). The same analysis was applied to the data from the cell death experiment and indicated that no statistically significant increase in cell death was produced by olaparib when coadministered with 10–15 μM 35d. In cultures exposed to olaparib + 20 μM 35d the evidence for cell death was markedly increased and statistically significant, with p < 0.0001. (B) After the 72 h treatment, BxPC3 cells were stained with vital dyes. As shown in the microscope pictures, the only culture displaying sharp evidence of cell death was that exposed to the combination of olaparib/20 μM 35d, as demonstrated by PI nuclear staining.

