Figure 4.

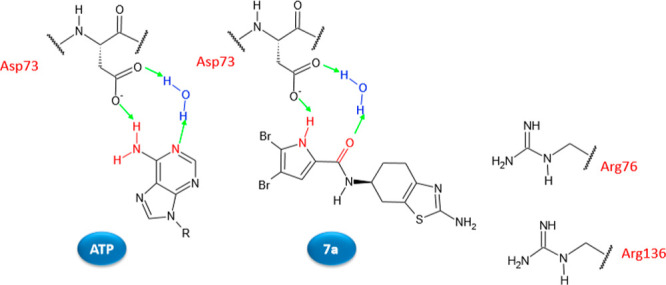
Schematic representation of the binding mode in the E. coli GyrB ATP-binding site of ATP and compound 7a. Hydrogen bonds are represented as green arrows.

Schematic representation of the binding mode in the E. coli GyrB ATP-binding site of ATP and compound 7a. Hydrogen bonds are represented as green arrows.