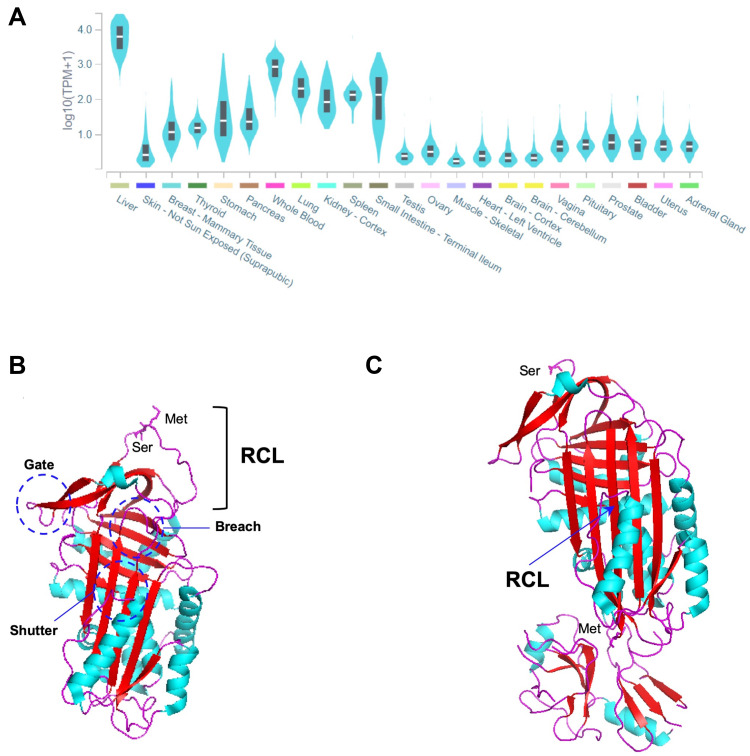
Figure 1.
(A) SERPINA1 expression across different tissues. The graph was built in GTEx portal (https://gtexportal.org/home/) using the RNAseq data from multiple individuals generated by the Genotype-Tissue Expression (GTEx) project. (B) Three-dimensional structure of an active AAT molecule (PDB code: 1QLP). The breach, shutter and gate domains are highlighted by dark blue circles. The reactive center loop (RCL) and Met-Ser bond (P1-P1ʹ) therein are indicated. (C) Three-dimensional structure of an AAT molecule bond to trypsin in a protease-inhibitor complex (PDB code: 1EXZ). The inserted β-strand of the RCL and the Met358 and Ser359 residues from the cleaved P1-P1ʹ are indicated. α-helixes are shown in light blue, β-strands in red and loops in magenta. The three-dimensional images were generated using PyMOL.112

