Figure 4.
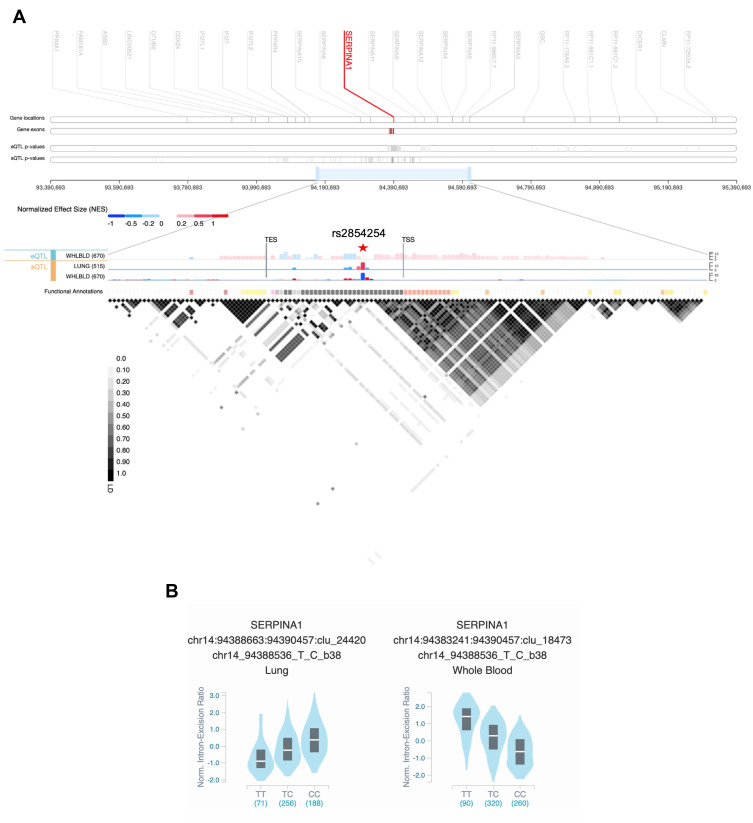
(A) SERPINA1 cis-quantitative trait loci (QTL) view in Genotype-Tissue Expression (GTEx) Locus Browser (https://gtexportal.org/home/). The top section shows the genomic region 1Mb up- and downstream of SERPINA1. In the middle, expression QTLs (eQTL) and splicing QTLs (sQTL) of SERPINA1 are portrayed as bar charts in lung and whole blood with the –log10(p-value) represented in the y-axis. The liver tissue was not available for QTLs analysis. The variant with the most significant p-value – rs2854254 – is highlighted by a red star symbol. The last row shows the functional annotation of the variants according to Ensembl’s Variant Predictor (VEP), Loss-Of-Function Transcript Effect (LOFTEE) and Ensembl Regulatory Build. At the bottom, the plot depicts the pairwise linkage disequilibrium (LD) values (R2) of the QTL variants. TSS, transcription start site; TES, transcription end site. (B) Violin plots of allele-specific cis-sQTL effects of rs2854254 genotypes on SERPINA1 in human lung and whole blood (GTEx database – GTEx Analysis Release v8).

