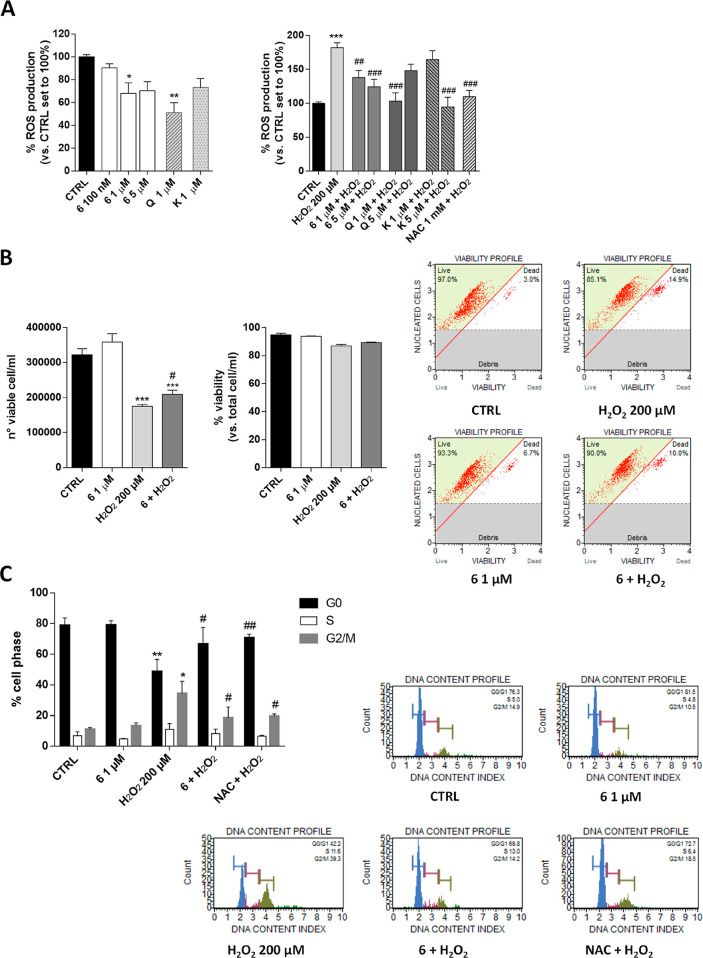
Figure 3.
Effect of compound 6 on ROS production, cell death, and cell cycle progression. hGF cells were treated with different concentrations of compound 6, quercetin (Q), kaempferol (K), or NAC as indicated, alone or in the presence of H2O2 (200 μM) for 72 h in complete medium. The ROS levels were evaluated by H2DCFDA (A). Data are expressed as the percentage of ROS with respect to the amount in the CTRL set to 100%. Each bar represents the mean ± SD of three replicates from two independent experiments. (B) Flow cytometry analysis of cell death was performed as described in the Experimental Section. Data are reported as the number of cells/mL and as percentage of cell death. Each bar represents the mean ± SD of two replicates from two independent experiments. Representative histograms are shown. (C) Flow cytometry analysis of the cell cycle was performed as described in the Experimental Section. Data are reported as the percentage of cells in each cell phase. Each bar represents the mean ± SD of two replicates from two independent experiments. Representative histograms are shown. The significance of the differences was determined by one-way ANOVA, which was followed by Bonferroni’s post-test: *p < 0.05, **p < 0.01, ***p < 0.001, vs CTRL; #p < 0.05, ##p < 0.01, ###p < 0.001 vs H2O2.

