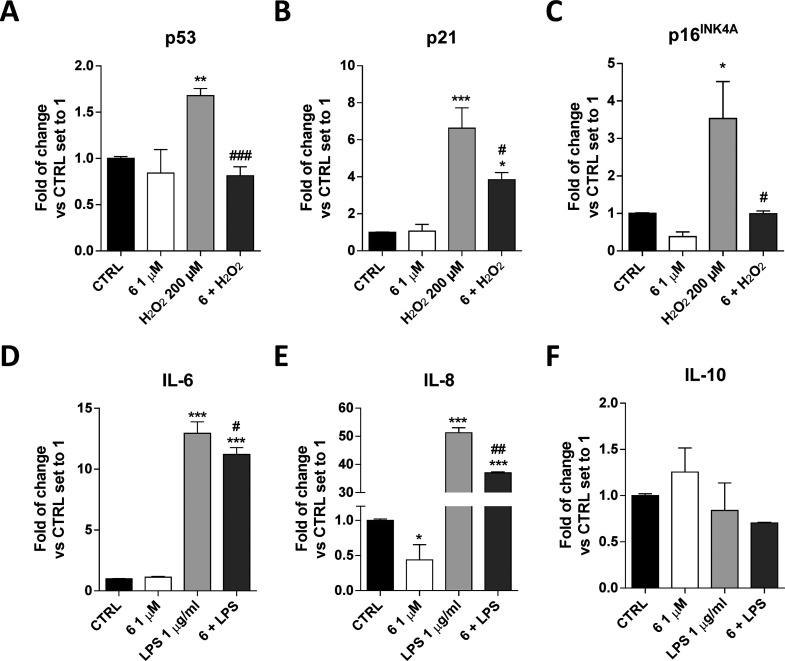
Figure 4.
Compound 6 modulation of senescence-associated and cytokine gene expression in hGF. hGF cells were treated with different concentrations of compound 6 alone or in the presence of H2O2 (200 μM) or LPS (1 μg/mL) for 72 h in complete medium. Then, the mRNA levels of p53 (A), p21 (B), p16INK4A (C), IL-6 (D), IL-8 (E), and IL-10 (F) were quantified using real-time RT-PCR analysis. Data are expressed as the fold change versus the CTRL, which was set to 1, and are presented as the mean values ± SD of two independent experiments performed in duplicate. The significance of the differences was determined by one-way ANOVA, which was followed by Bonferroni’s post-test: *p < 0.05, **p < 0.01, ***p < 0.001 vs CTRL; #p < 0.05, ##p < 0.01, ###p < 0.001 vs H2O2 or LPS.

