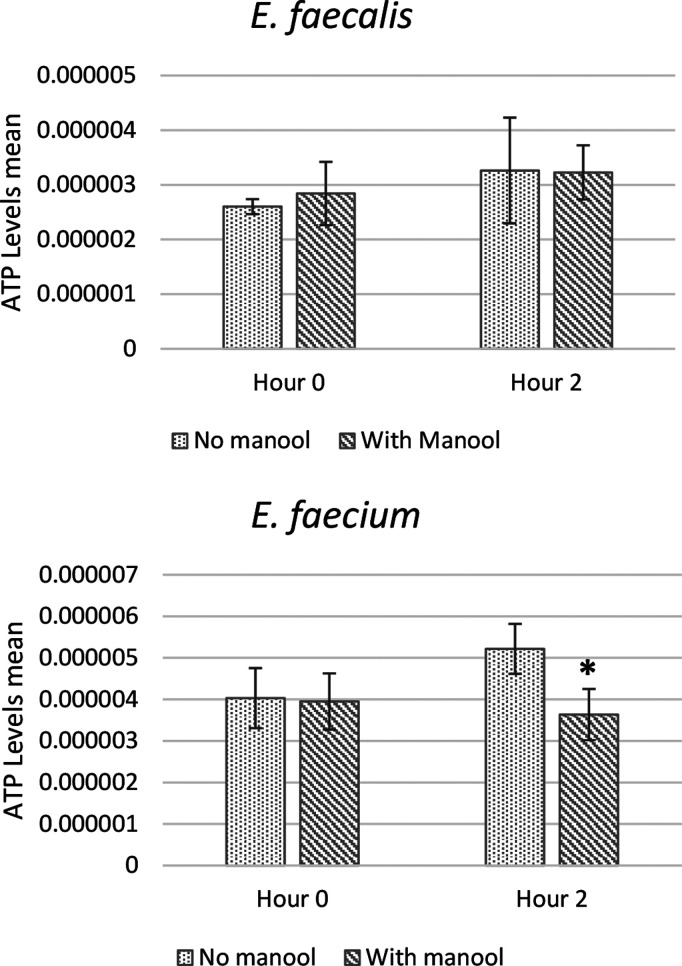
Figure 4.
ATP levels determined by measuring luminescence levels and comparing with an ATP standard curve. Amount of ATP (pmol/cfu) produced by E. faecalis MB 1 (VRE) and E. faecium MB 152 (VRE) in the absence and in the presence of manool (17) (5 × MIC) at time of inoculum and after 2 h of incubation at T = 37 °C. Results are expressed as mean ± SD of three separate experiments, with three replicates per experiment. Statistically significant differences between treatment and control groups were determined using Student’s t test (p < 0.05).

