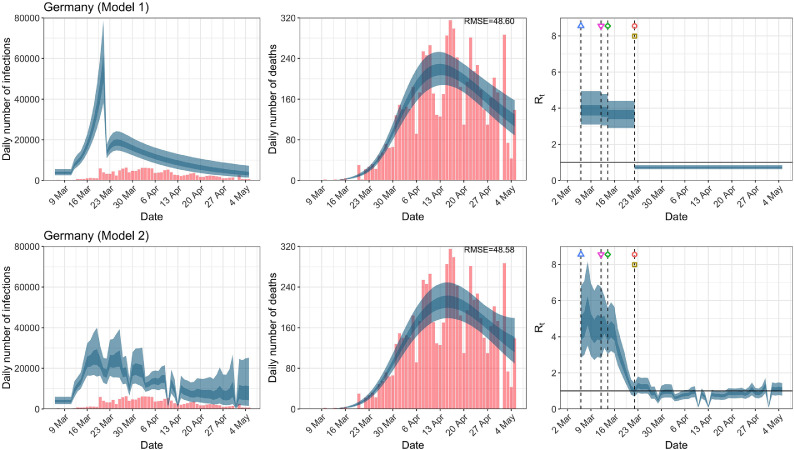
Fig. C.6.
Daily infections, daily deaths and in Germany until May 5th. The start time for the plots is 10 days before 10 deaths are recorded. Observed counts of daily infections and daily deaths are shown in red, and their corresponding 50% and 95% CIs are shown in dark blue and light blue, respectively. (For interpretation of the references to color in this figure legend, the reader is referred to the web version of this article.)

