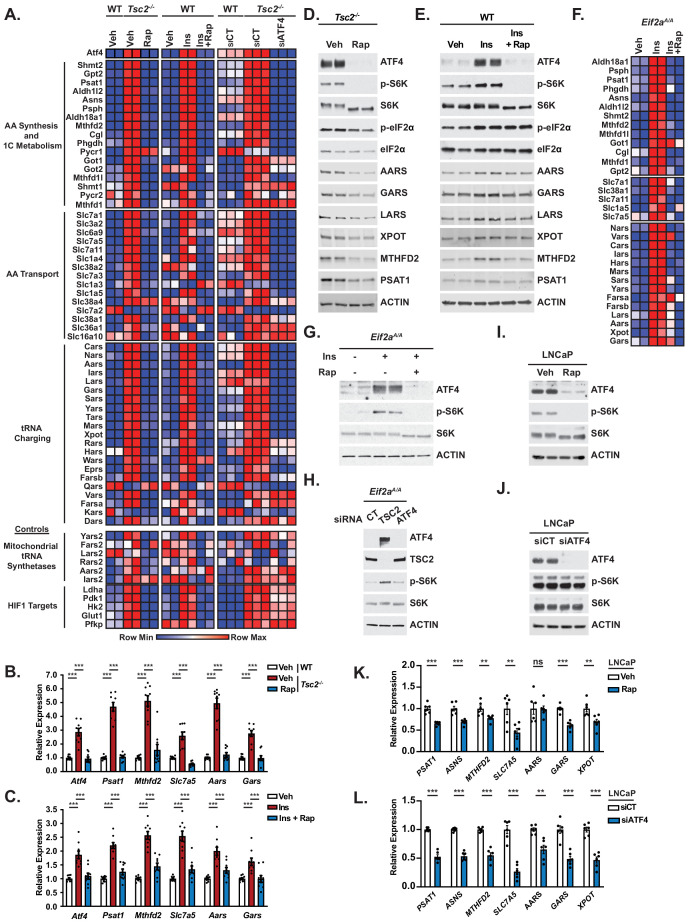
Figure 3. Mechanistic target of rapamycin complex 1 (mTORC1) and activating transcription factor 4 (ATF4) regulate genes involved in amino acid synthesis, transport, and tRNA charging.
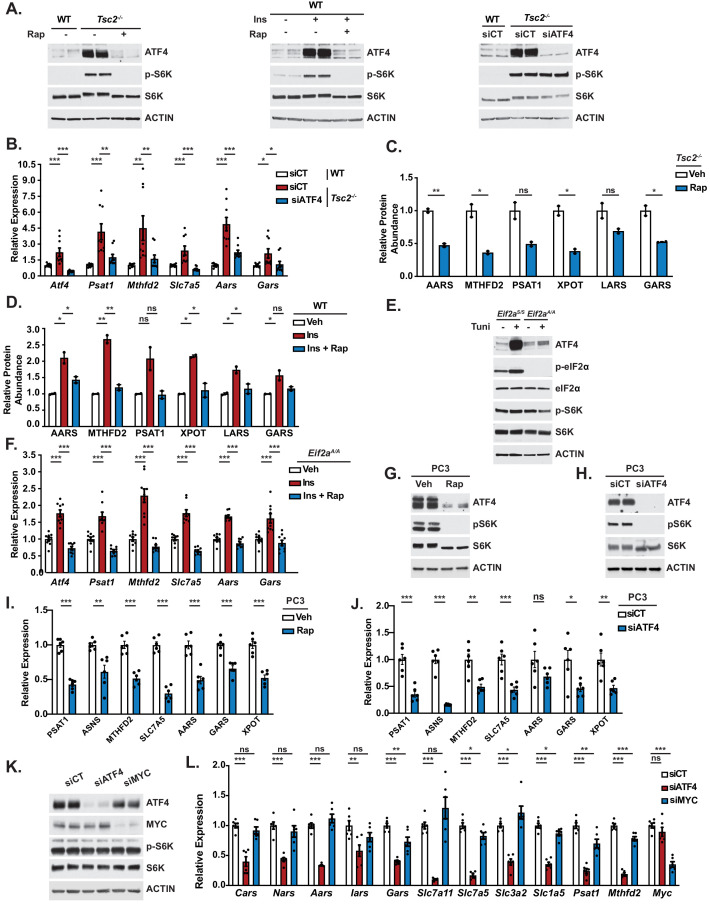
(A) Row-normalized heatmaps of NanoString gene expression data are shown from (1) serum-deprived wild-type (WT) or Tsc2-/-mouse embryo fibroblasts (MEFs) treated (16 hr) with vehicle (Veh) or rapamycin (20 nM, Rap) (n = 2), (2) serum-deprived WT MEFs treated with insulin (500 nM, 16 hr, Ins) following 30 min pretreatment with vehicle or rapamycin (20 nM) (n = 2), and (3) WT and Tsc2-/- MEFs transfected with Atf4 siRNAs or non-targeting controls (siCT) and serum-deprived for 16 hr (n = 3). Genes are grouped by functional category and ranked in order of most significantly decreased with ATF4 knockdown for each group. Heatmap values are provided in Figure 3—source data 1, and effects on ATF4 protein levels and mTORC1 signaling for each condition are shown by immunoblot in Figure 3—figure supplement 1A. (B, C) qPCR analysis of the indicated transcripts in WT and Tsc2-/- MEFs (B) or WT MEFs stimulated with insulin in the presence or absence of rapamycin (C) as in (A). Expression relative to vehicle-treated, unstimulated WT cells is graphed as mean ± SEM from three independent experiments, each with three biological replicates (n = 9). Effects of ATF4 knockdown are shown in Figure 3—figure supplement 1B. (D, E) Representative immunoblots of Tsc2-/- MEFs treated with vehicle or rapamycin as in (A) or serum-deprived WT MEFs stimulated with insulin (500 nM, 24 hr) following 30 min pretreatment with vehicle or rapamycin (20 nM), with biological duplicates shown for each condition. Quantification provided in Figure 3—figure supplement 1C, D. (F) Row-normalized heatmaps of NanoString gene expression data for transcripts in the functional groups from (A) found to be significantly (p<0.05) induced in eIF2αA/A MEFs treated with insulin (500 nM, 16 hr) following 30 min pretreatment with vehicle or rapamycin (20 nM) (n = 2). Genes are ranked by category in order of most significantly increased with insulin for each group. The heatmap values are provided in Figure 3—source data 1. Immunoblots validating that these cells are defective in the integrated stress response and qPCR validation of representative genes are provided in Figure 3—figure supplement 1E, F. (G) Representative immunoblot of cells treated as in (F), with biological duplicates shown for each condition. (H) Representative immunoblot of eIF2αA/A MEFs transfected with siRNAs targeting Atf4, Tsc2, or non-targeting controls (CT) prior to serum starvation for 16 hr. (I, J) Representative immunoblot of serum-deprived LNCaP cells treated with vehicle or rapamycin (20 nM, 16 hr) (I) or Atf4 siRNAs versus non-targeting controls (siCT) (J), with biological duplicates shown for each. (K, L) qPCR analysis of the indicated transcripts in LNCaP cells serum-starved in the presence of vehicle or rapamycin (20 nM, 16 hr) (K) or transfected with ATF4 siRNAs or non-targeting controls (siCT) and serum-starved for 16 hr (L). Expression relative to vehicle-treated cells is graphed as mean ± SEM from two independent experiments, with three biological replicates each (n = 6). Immunoblots and qPCR analysis for PC3 cells treated as in (I–L) are provided in Figure 3—figure supplement 1G–J, and effects of c-Myc knockdown on representative gene targets are shown in Figure 3—figure supplement 1K, L. *p<0.05, **p<0.01, ***p<0.001, ns = not significant. One-way analysis of variance with Holm–Sidak method for multiple comparisons was used to determine statistical significance for (B, C). Unpaired two-tailed t-test was used to determine statistical significance for (F, K, L). (D, E, G, H, I, J) are representative of at least two independent experiments.


