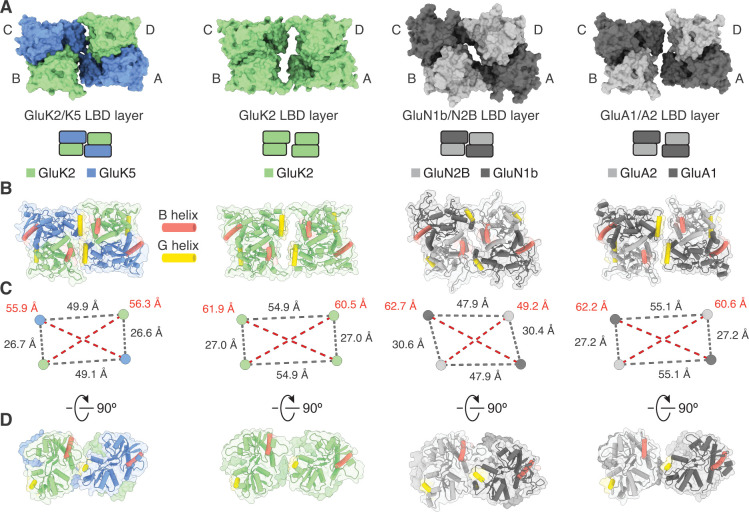
Figure 2. Analysis of the GluK2/K5 ligand binding domain (LBD) layer.
(A) Extracellular view of LBD layers for (left to right) GluK2/K5em, GluK2, GluN1b/N2B, and GluA1/A2. The LBD layers are extracted from full-length antagonist-bound cryo-electron microscopy (cryo-EM) structures: GluK2/K5em-CNQX, GluK2-LY466195 (PDB: 5KUH), GluN1b/N2B-SDZ 220–040/L689,560 (PDB: 6WHU), GluA1/A2-γ8-NBQX (PDB: 6QKC). (B) LBD layers as viewed in (A), but shown with secondary structure and helices B (red) and G (yellow) colored as visual guides for subunit orientation. (C) Intersubunit measurements for heteromeric LBD layers as shown in (A). Measurements are between the centers of mass for each LBD as calculated in UCSF ChimeraX. (D) LBDs are shown colored as in (B) but viewed parallel to the membrane.

