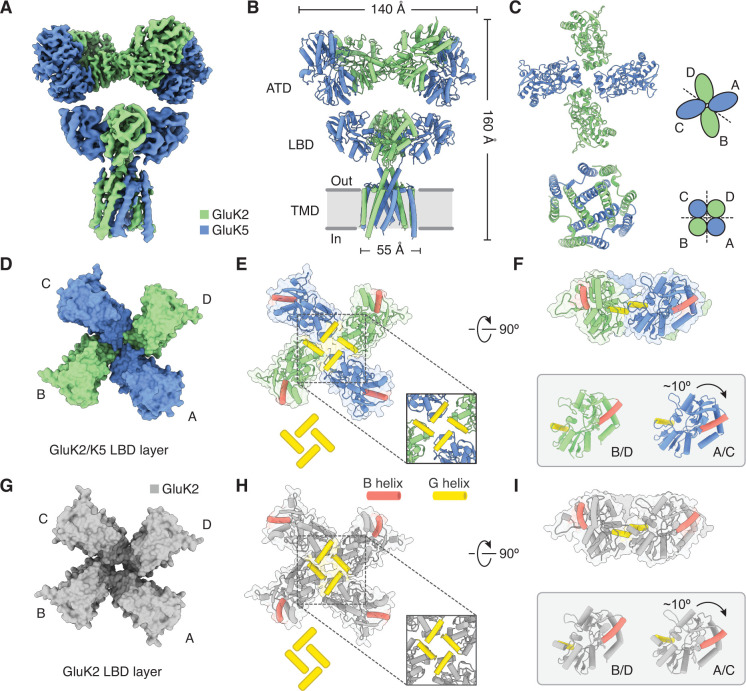
Figure 4. Structure of GluK2/K5 in a desensitized state.
(A) Cryo-electron microscopy (cryo-EM) structure of the GluK2/K5em heteromer in a L-glutamate (L-Glu)-bound state with GluK2em and GluK5em subunits rendered in green and blue, respectively. The panel shows the map for the amino terminal domain (ATD) layer and the map for the ligand binding domain (LBD)-transmembrane domain (TMD) assembly which were reconstructed independently, as described in the text. (B) Molecular model for the receptor is colored as in (A) and shown parallel to the membrane. (C) The LBD (top) and TMD (bottom) layers as viewed from the extracellular space. The local symmetries of the LBD (twofold) and TMD (fourfold) are illustrated. (D and E) Top view of LBD layer for the GluK2/K5em heteromer. The model is shown without (D) and with (E) secondary structure. Helices B (red) and G (yellow) are colored as visual guides for subunit orientation. Inset highlights the desensitization ring formed by G helices. (F) LBDs are shown colored as in (E) but viewed parallel to the membrane. Individual B/D and A/C LBDs are aligned and presented to highlight different out of plane tilts, and the more elevated position of the G helices in A/C subunits. (G–I) Visualization of the LBD layer from the GluK2 homomer (PDB: 5KUF). GluK2 subunits shown in gray, and panel coloring and arrangement is otherwise the same as in (D–F).


