. 2021 Mar 17;10:e63886. doi: 10.7554/eLife.63886

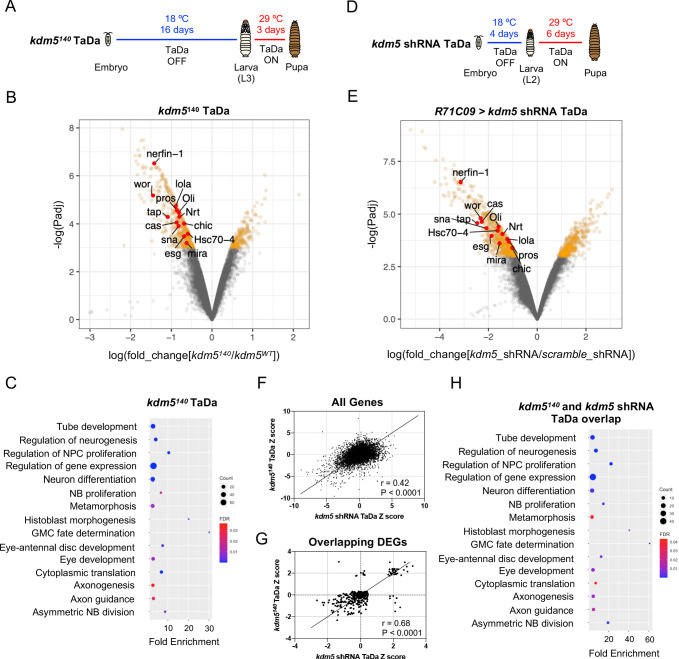
Figure 5. Transcriptome profiling of lysine demethylase 5 (KDM5)-depleted ganglion mother cells (GMCs) and immature neurons by targeted DamID (TaDa) reveals KDM5-regulatory networks critical for ganglion mother cell (GMC) proliferation and neurodevelopment.

(A) Timeline of TaDa induction within GMCs and immature neurons of kdm5140 WL3 animals and pupae. (B) Volcano plot of differentially expressed genes (DEGs) within GMCs and immature neurons of kdm5140 animals compared to wild type. Genes with a false discovery rate (FDR) < 0.05 are in red, with those labeled involved in GMC proliferation and neurodevelopment. TaDa analyses were performed in quintuplicate. (C) Representative distribution of ontology terms for DEGs in kdm5140 GMCs and immature neurons using a PANTHER Overrepresentation Test (Fisher’s exact test with FDR < 0.05). (D) Timeline of TaDa and kdm5 shRNA induction within GMCs and immature neurons of WL3 animals and pharate adults. (E) Volcano plot of DEGs within kdm5 shRNA GMCs and immature neurons compared to those expressing a scrambled shRNA. Genes with an FDR < 0.05 are in red, with those labeled involved in GMC proliferation and neurodevelopment. TaDa analyses were performed in triplicate. (F) Correlation of Z scores between DEGs of kdm5140 and kdm5 shRNA TaDa datasets (Deming regression; p<0.0001). (G) Correlation of Z scores between overlapping DEGs of kdm5140 and kdm5 shRNA TaDa datasets (Deming regression; p<0.0001). (H) Representative distribution of ontology terms for DEGs in overlapping kdm5140 and kdm5 shRNA TaDa datasets utilizing a PANTHER Overrepresentation Test (Fisher’s exact test with FDR < 0.05).

Figure 5.

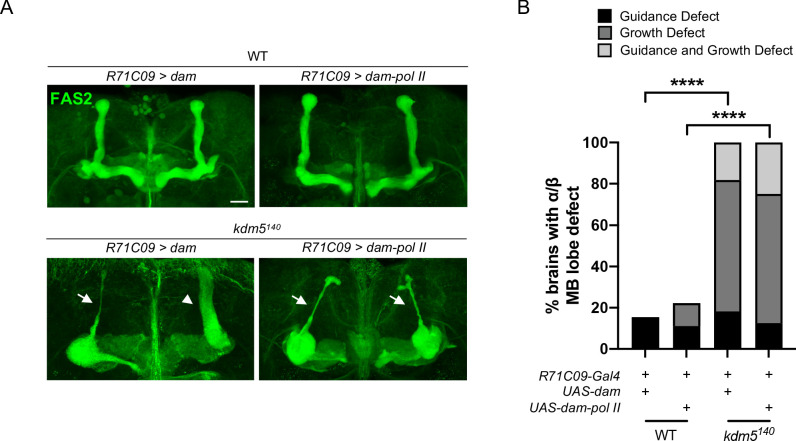
Figure 5—figure supplement 1. kdm5140 pharate adults expressing targeted DamID (TaDa) genetic elements present with significant mushroom body (MB) morphological defects.

Figure 5—figure supplement 1.

(A) Representative α/β lobe Z projections of pharate kdm5140 animals expressing TaDa genetic elements and their respective controls. The antibody anti-fasciclin 2 is used to visualize α/β lobes. Arrows indicate growth defects. Scale bar represents 20 μm. (B) Quantification of α/β lobe defects in pharate kdm5140 animals expressing TaDa genetic elements and their respective controls. n = 8–22 (mean n = 13). ****p<0.0001 (chi-square test with Bonferroni correction).
Figure 5—figure supplement 2. Knockdown of myc within Kenyon cells does not result in morphological defects of the mushroom body.

Figure 5—figure supplement 2.

Representative α/β lobe Z projections of adults expressing myc dsRNA driven by OK107-Gal4. No gross morphological defects were detected in the KD or control conditions n = 29–30.
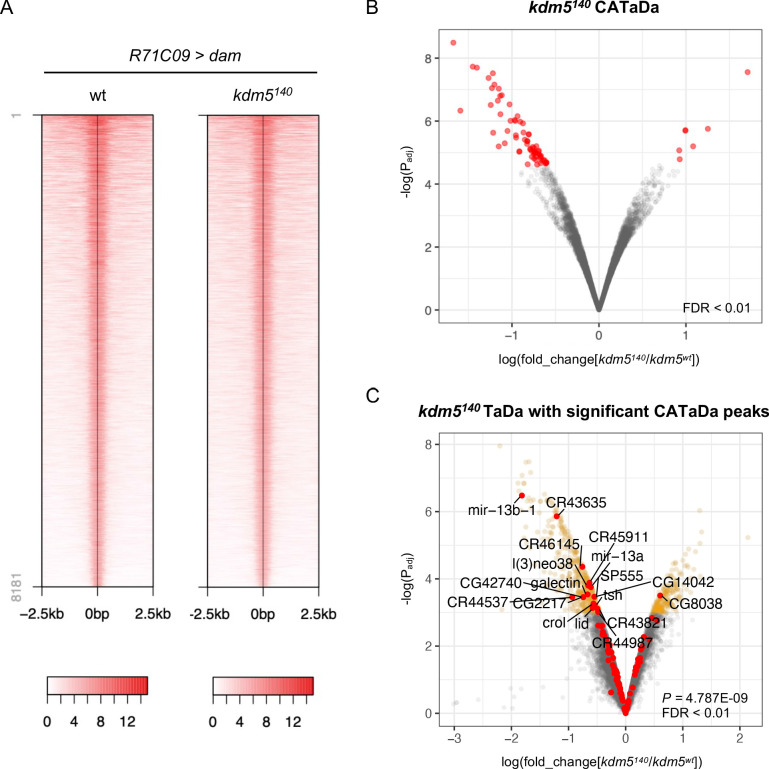
Figure 5—figure supplement 3. Chromatin accessibility profiling using targeted DamID (CATaDa) analyses reveal minimal changes to chromatin accessibility within ganglion mother cells (GMCs) and immature neurons upon loss of kdm5.

Figure 5—figure supplement 3.

(A) Representative CATaDa profiles of R71C09-Gal4 expressing cells for kdm5140 and wild type. Heat maps show Dam binding profiles for the greatest 8181 peaks for each genotype. (B) Volcano plot showing changes to chromatin accessibility within GMCs and immature neurons of kdm5140 animals compared to wild type. Genes with an FDR < 0.01 are in yellow. CATaDa analyses were performed in quintuplicate. (C) Volcano plot showing changes to chromatin accessibility for differentially expressed genes (DEGs) from kdm5140 TaDa. In yellow are kdm5140 TaDa DEGs with an FDR < 0.05. In red are kdm5140 TaDa DEGs with associated changes in chromatin accessibility for FDR < 0.01 (Fisher’s exact test, p=4.79E-09).
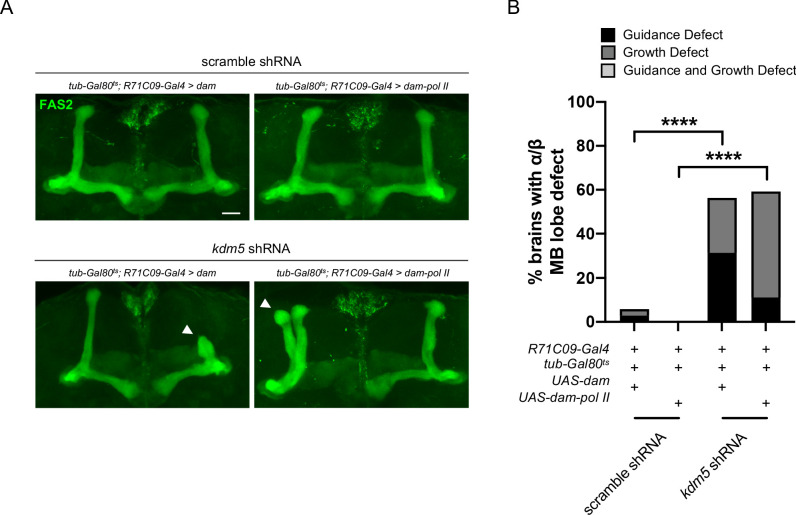
Figure 5—figure supplement 4. Adults expressing R71C09-Gal4-driven kdm5 shRNA in tandem with targeted DamID (TaDa) genetic elements present with significant mushroom body morphological defects.

Figure 5—figure supplement 4.

(A) Representative α/β lobe Z projections of adult R71C09 > kdm5 shRNA animals expressing TaDa genetic elements and their respective controls. The antibody anti-fasciclin 2 is used to visualize α/β lobes. Arrowheads indicate guidance defects. Scale bar represents 20 μm. (B) Quantification of α/β lobe Z projections of adult R71C09 > kdm5 shRNA animals expressing TaDa genetic elements and their respective controls. n = 16–34 (mean n = 28). ****p<0.0001 (chi-square test with Bonferroni correction).
Figure 5—figure supplement 5. Transcriptome analyses reveal that lysine demethylase 5 (KDM5)-regulated gene expression is tissue-specific.

Figure 5—figure supplement 5.

(A) Venn diagram illustrating intersection of kdm5140 and kdm5 shRNA overlapping targeted DamID (TaDa) data with that from a previously published kdm5140 mRNA-seq wing disc dataset (Drelon et al., 2018). (B) Correlation of Z scores between kdm5140 TaDa and kdm5140 wing disc mRNA-seq (Drelon et al., 2018) datasets. Pearson’s R = 0.09.