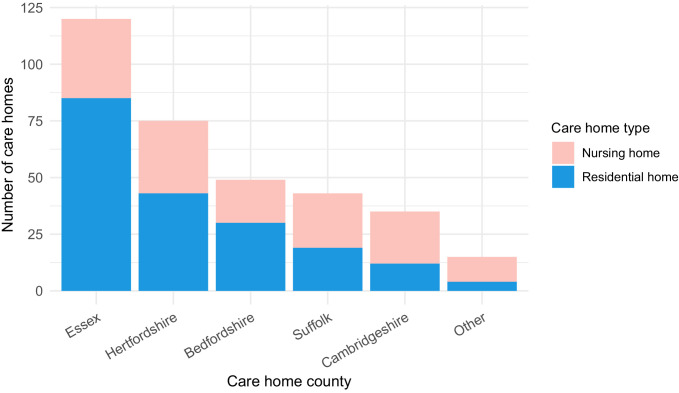
Figure 2. Care home locations by county, showing nursing, and residential homes.
Only showing the five counties with the largest number of cases (all >25) to preserve patient anonymity. Definitions of ‘nursing home’ and ‘residential home’ are based on Care Quality Commission (CQC) information on whether nursing care is or is not present. If no nursing care is available the home is classified as a residential home. If the care home offers nursing care (including if it can offer both nursing and residential care) then the home is classified as a nursing home.


