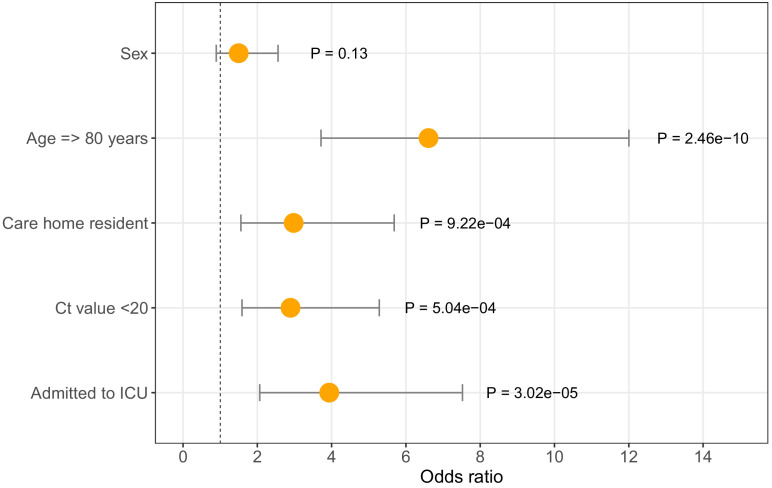
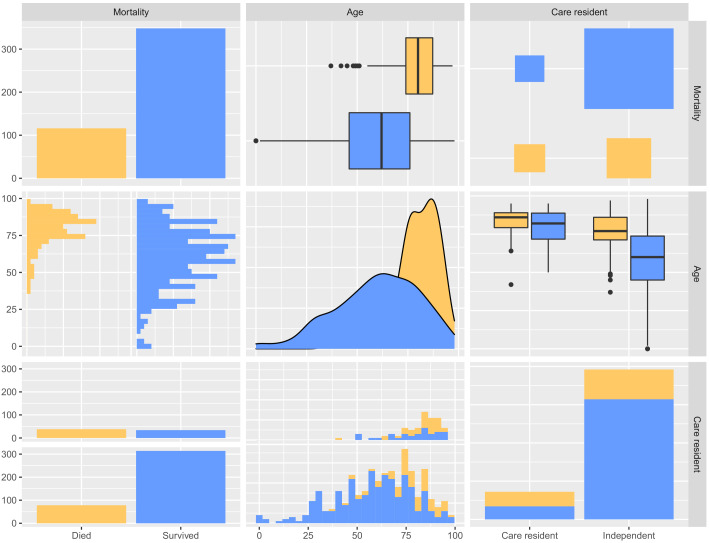
Figure 4. Odds ratios for mortality at 30 days.
Logistic regression analysis showing odds of death at 30 days (with 95% confidence intervals) for five available metadata variables: patient sex, age (here categorised as >80 years), whether they were a care home resident, the diagnostic Ct value (here categorised as <20), and whether they were admitted to the intensive care unit. Overall there were 116 deaths within 30 days of diagnosis (out of 464 CUH patients). ICU = intensive care unit. Ct = Cycle threshold for diagnostic PCR.


