. 2021 Mar 2;10:e64618. doi: 10.7554/eLife.64618

Figure 6. Care home clustering on viral phylogenetic tree and within-care home pairwise SNP differences.

(A) Phylogenetic tree of 1400 East of England SARS-CoV-2 genomes rooted on a sample from Wuhan, China, collected December 2019, including 700 care home residents and 700 randomly selected non-care home residents. The colour bar (right) indicates whether samples were from care home residents (blue) or non-care home residents (grey). Samples from the 10 care homes with the largest number of genomes are highlighted by coloured circles on branch tips. A magnified subtree of the branch containing all 18 samples from care home CARE0314 is shown to the left. These genomes were all either identical or differed by one SNP from the most common genome in this cluster. Two non-care home genomes are also present in this group. Across the dataset, viruses from care home residents and people not living in care homes are phylogenetically intermixed, consistent with viral transmission between these two settings. (B) Distributions of pairwise SNP differences for the 10 care homes with the largest number of genomes (same samples as highlighted in the branch tips of panel A). Numbers above each box indicate the number of genomes present from that care home. Among the ten care homes with the largest number of genomes, some clustered closely on the phylogenetic tree with low pairwise SNP differences (e.g. CARE0063, CARE0264, CARE0314); in contrast, some care homes were distributed across the tree with higher pairwise SNP differences (e.g. CARE0061, CARE0151, CARE0173, CARE0263). Clusters within each care home were defined using integrated genomic and temporal data using the transcluster algorithm and are shown in Figure 7.

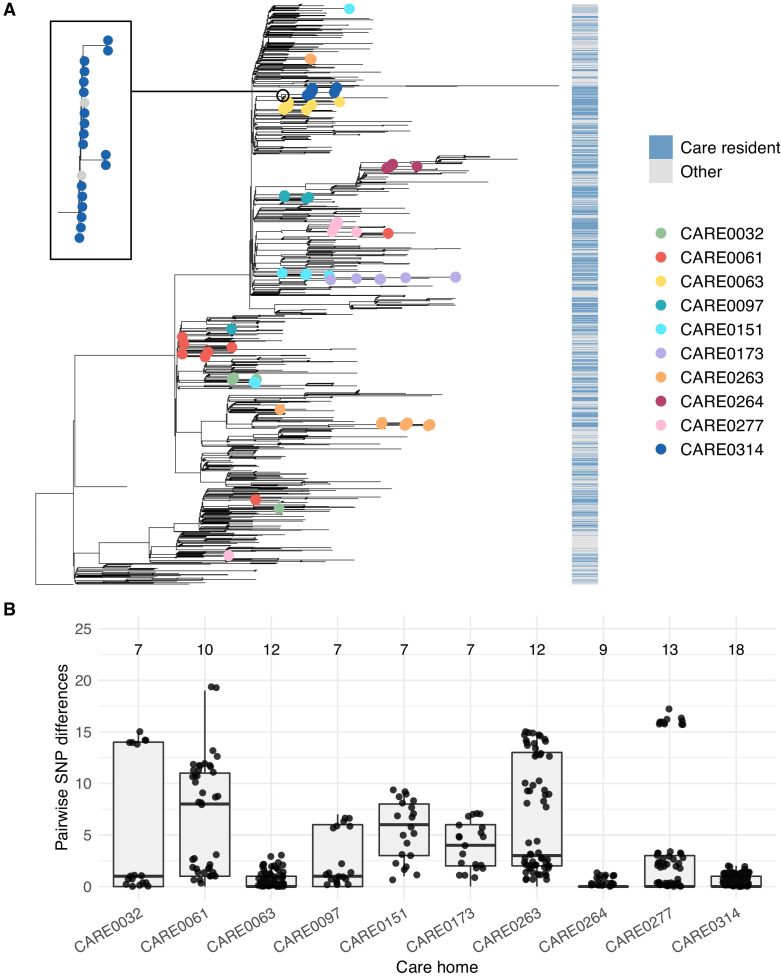
Figure 6.

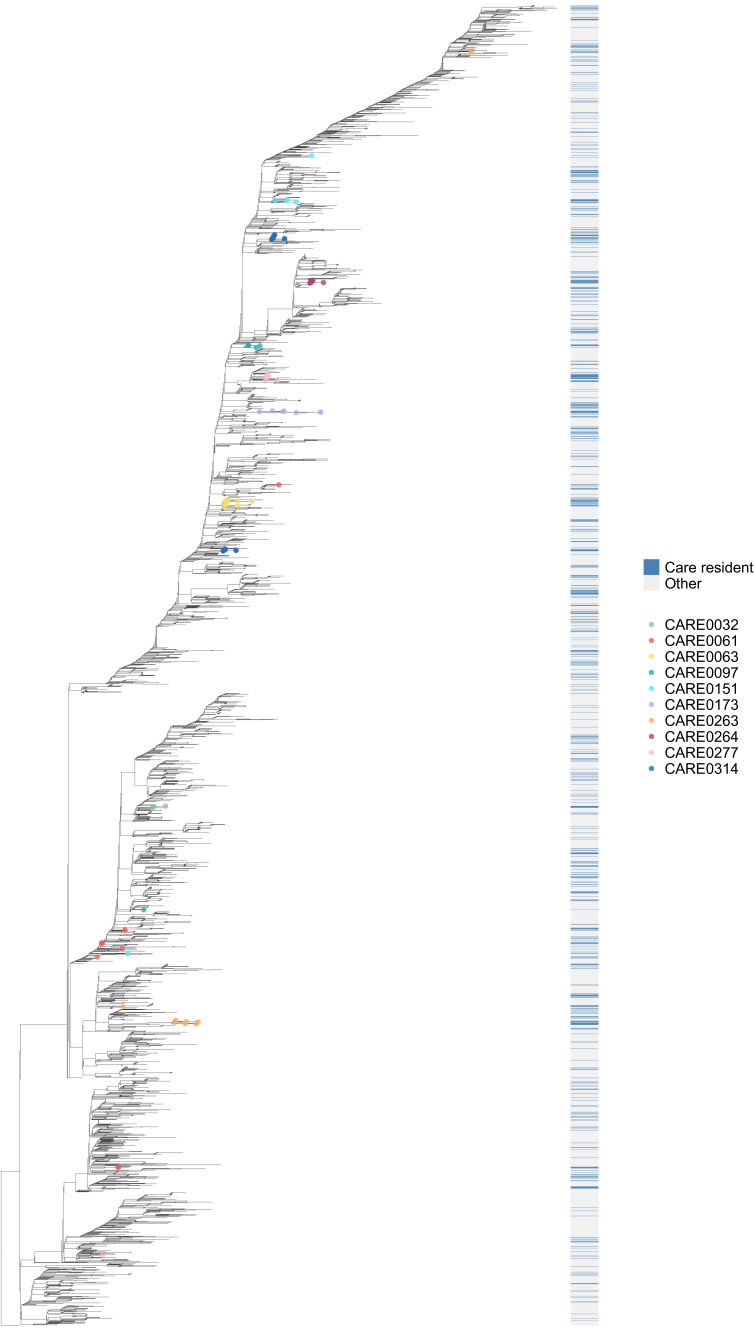
Figure 6—figure supplement 1. Phylogenetic tree of all available genomes highlighting care home and non-care home samples.

Figure 6—figure supplement 1.

Of the 6600 individuals in the study, 1167 were identified as care home residents and 5246 were not care home residents (187 were undetermined). 700/1167 (60.0%) care home residents had genomes available that passed quality control (QC) filtering at time of analysis. Of 5246, 3745 (71.4%) non-care home residents had genomes available and passing the same QC filtering at time of analysis, accessed from the COG-UK public database (https://www.cogconsortium.uk/data/). This tree comprises all 700 care home and 3745 non-care home genomes from the study (total 4445 samples), rooted on a 2019 genome from Wuhan, China. As with Figure 6, the colour bar (right) indicates whether samples were from care home residents (blue) or non-care home residents (grey). Samples from the ten care homes with the largest number of genomes are highlighted by coloured circles on branch tips. This supports the findings shown in Figure 6 using the randomly selected sub-sample of non-care home samples, (1) that care home genomes were phylogenetically intermixed with non-care home genomes (consistent with transmission between care homes and outside of care homes) and (2) that, using the 10 care homes with the largest number of samples as examples, some care homes were monophyletic (such as CARE0314) while others were polyphyletic (such as CARE0061). Even for polyphyletic care homes (implying multiple independent introductions of the virus among residents), the majority of samples were usually attributable to a single dominant cluster (described further in main text).