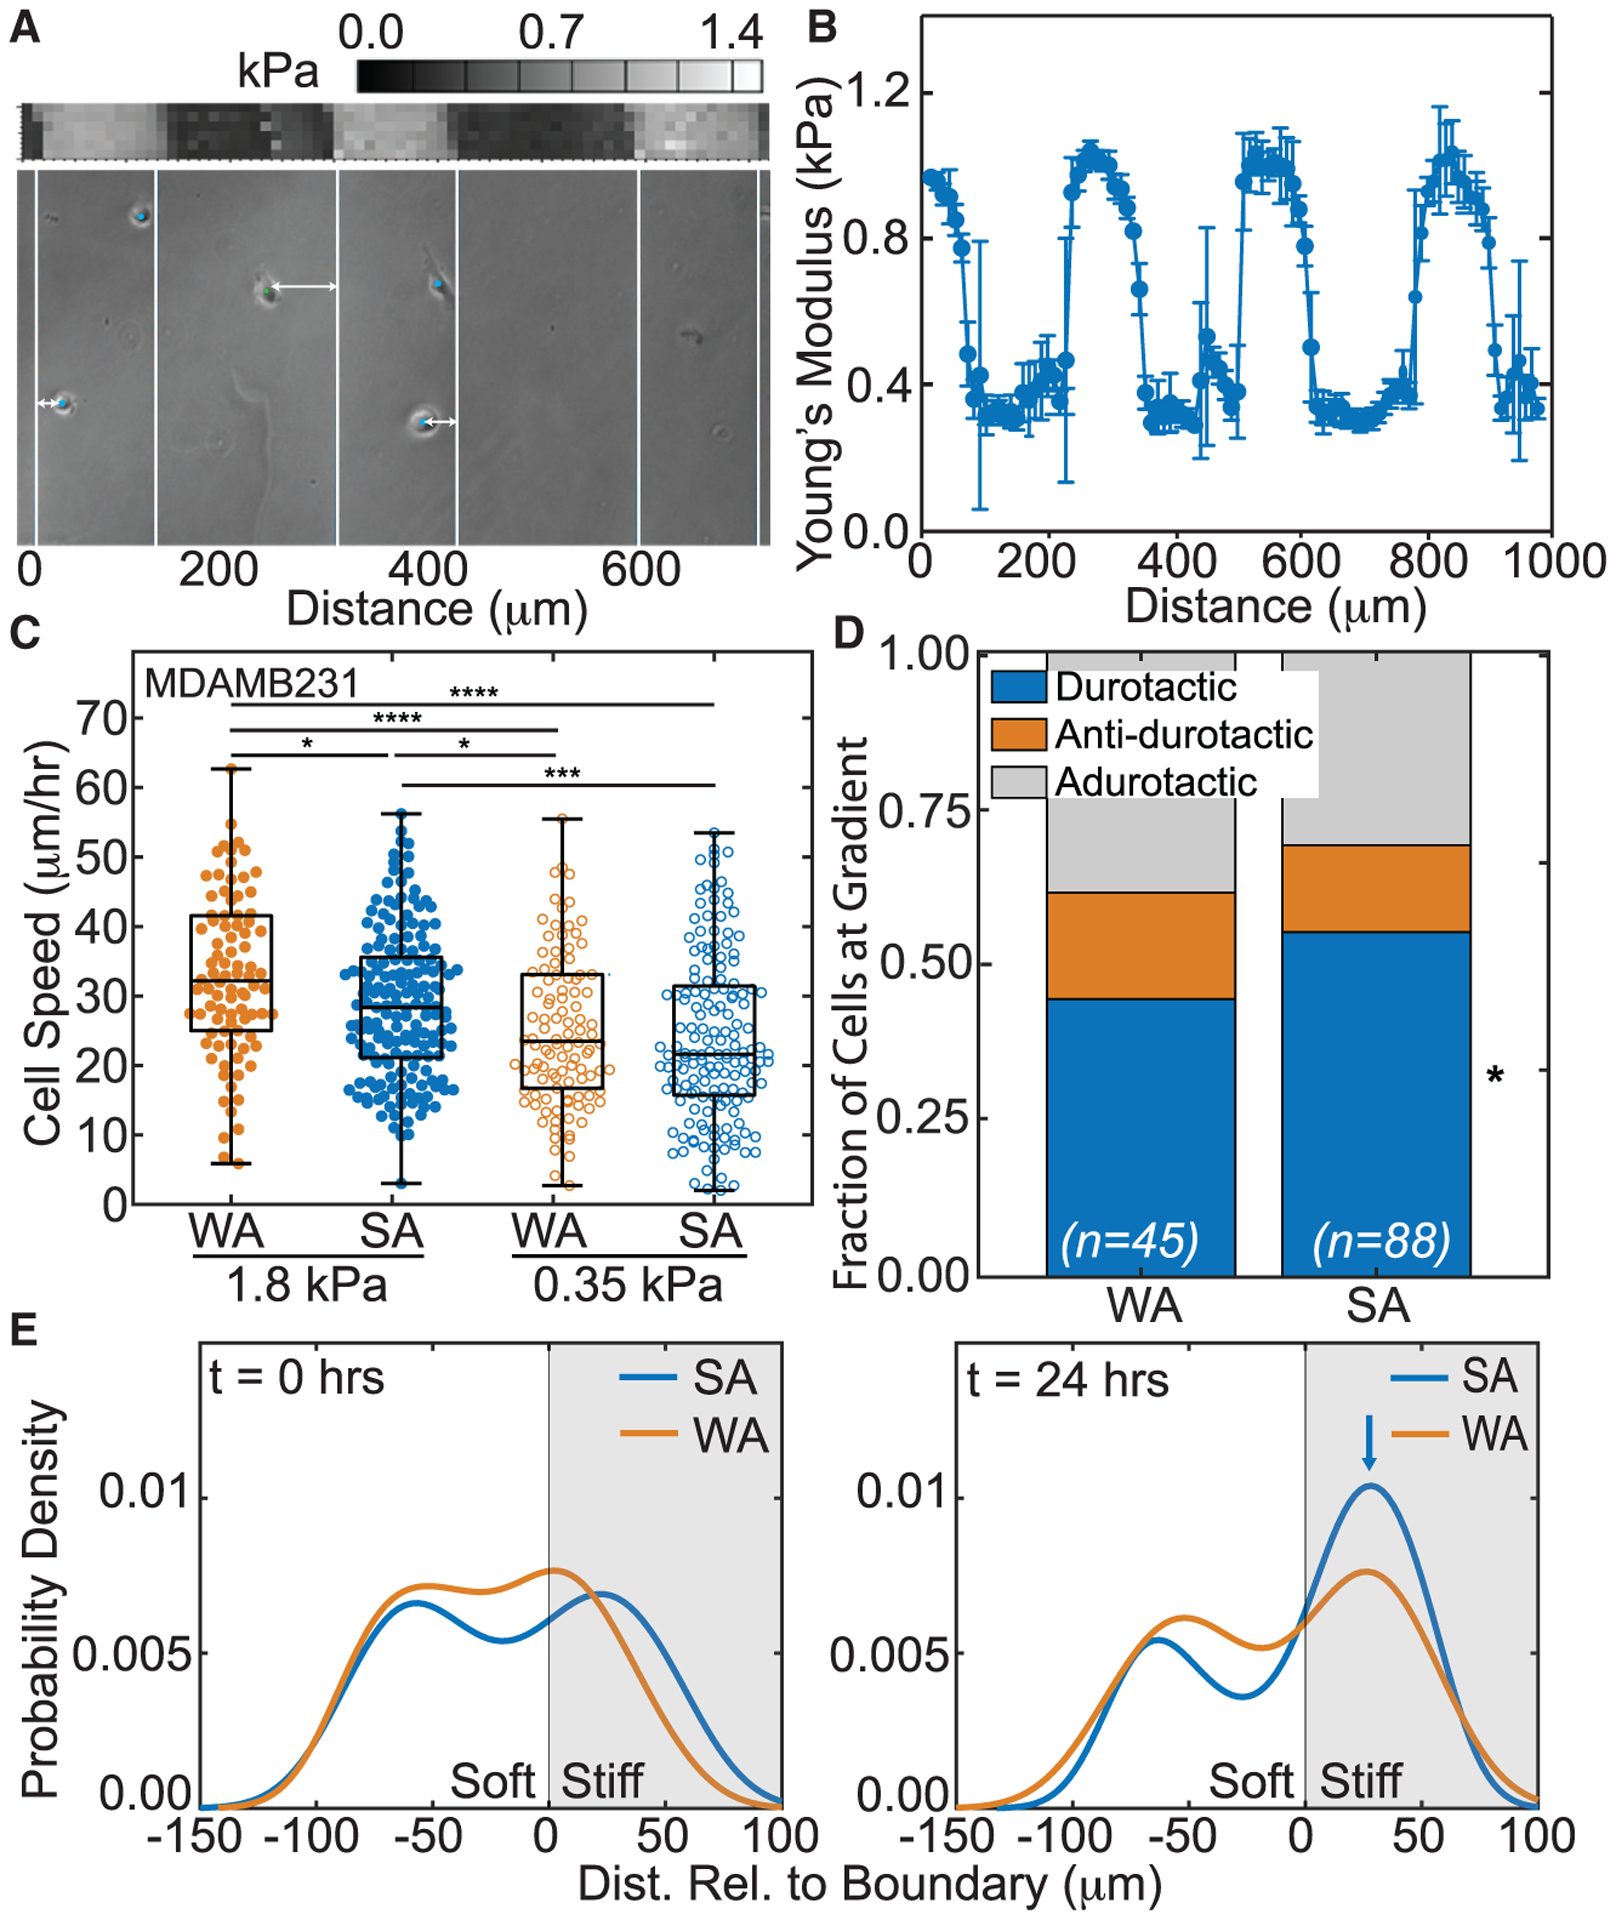
Figure 1. Weakly adherent cells exhibit higher adurotactic behavior.

(A) Bright-field image of cells (dots) with lines to indicate transitions between soft and stiff substrate regions of step-gradient hydrogels (bottom). Double-headed arrows indicate the distance relative to the closest gradient or boundary. Atomic force microscopy (AFM) map is also shown (center) with corresponding color map (top). Position is indicated in micrometers.
(B) Plot of average substrate stiffness versus position for step-gradient hydrogels (n > 3). Error bars represent standard deviation.
(C) MDA-MB-231 cell speed on soft or stiff side of step-gradient hydrogels is plotted. Data are shown for cells sorted by adhesion strength, i.e., weakly (orange) versus strongly (blue), and cells on softer (open) versus stiffer (closed) regions. (n > 144 cells for each condition from triplicate experiments). *p < 0.05, ***p < 10−3, ****p < 10−4 were determined by one-way ANOVA with Tukey test for multiple comparisons for the indicated comparisons.
(D) For adhesion-sorted MDA-MB-231 cells that encounter the step gradient, the fraction of durotactic, anti-durotactic, and adurotactic behavior is plotted. Data represent n = 45 of 144 WA cells and 88 of 237 cells that crossed the gradient over triplicate experiments. Comparisons made using a Fisher’s exact test for the same migration behavior between WA and SA cells, *p < 0.05.
(E) At 0 and 24 h, probability density function of MDA-MB-231 cell distribution (calculated using the unbounded kernel density function) versus hydrogel position is shown for weakly (orange) versus strongly (blue) adherent cells from triplicate experiments. The stiffer region is shaded in gray. Blue arrow indicates a peak in the strongly adherent cell distribution at 24 h.
