
Figure 4. Tuning contractility modulates adurotaxis in adhesion-sorted cells.
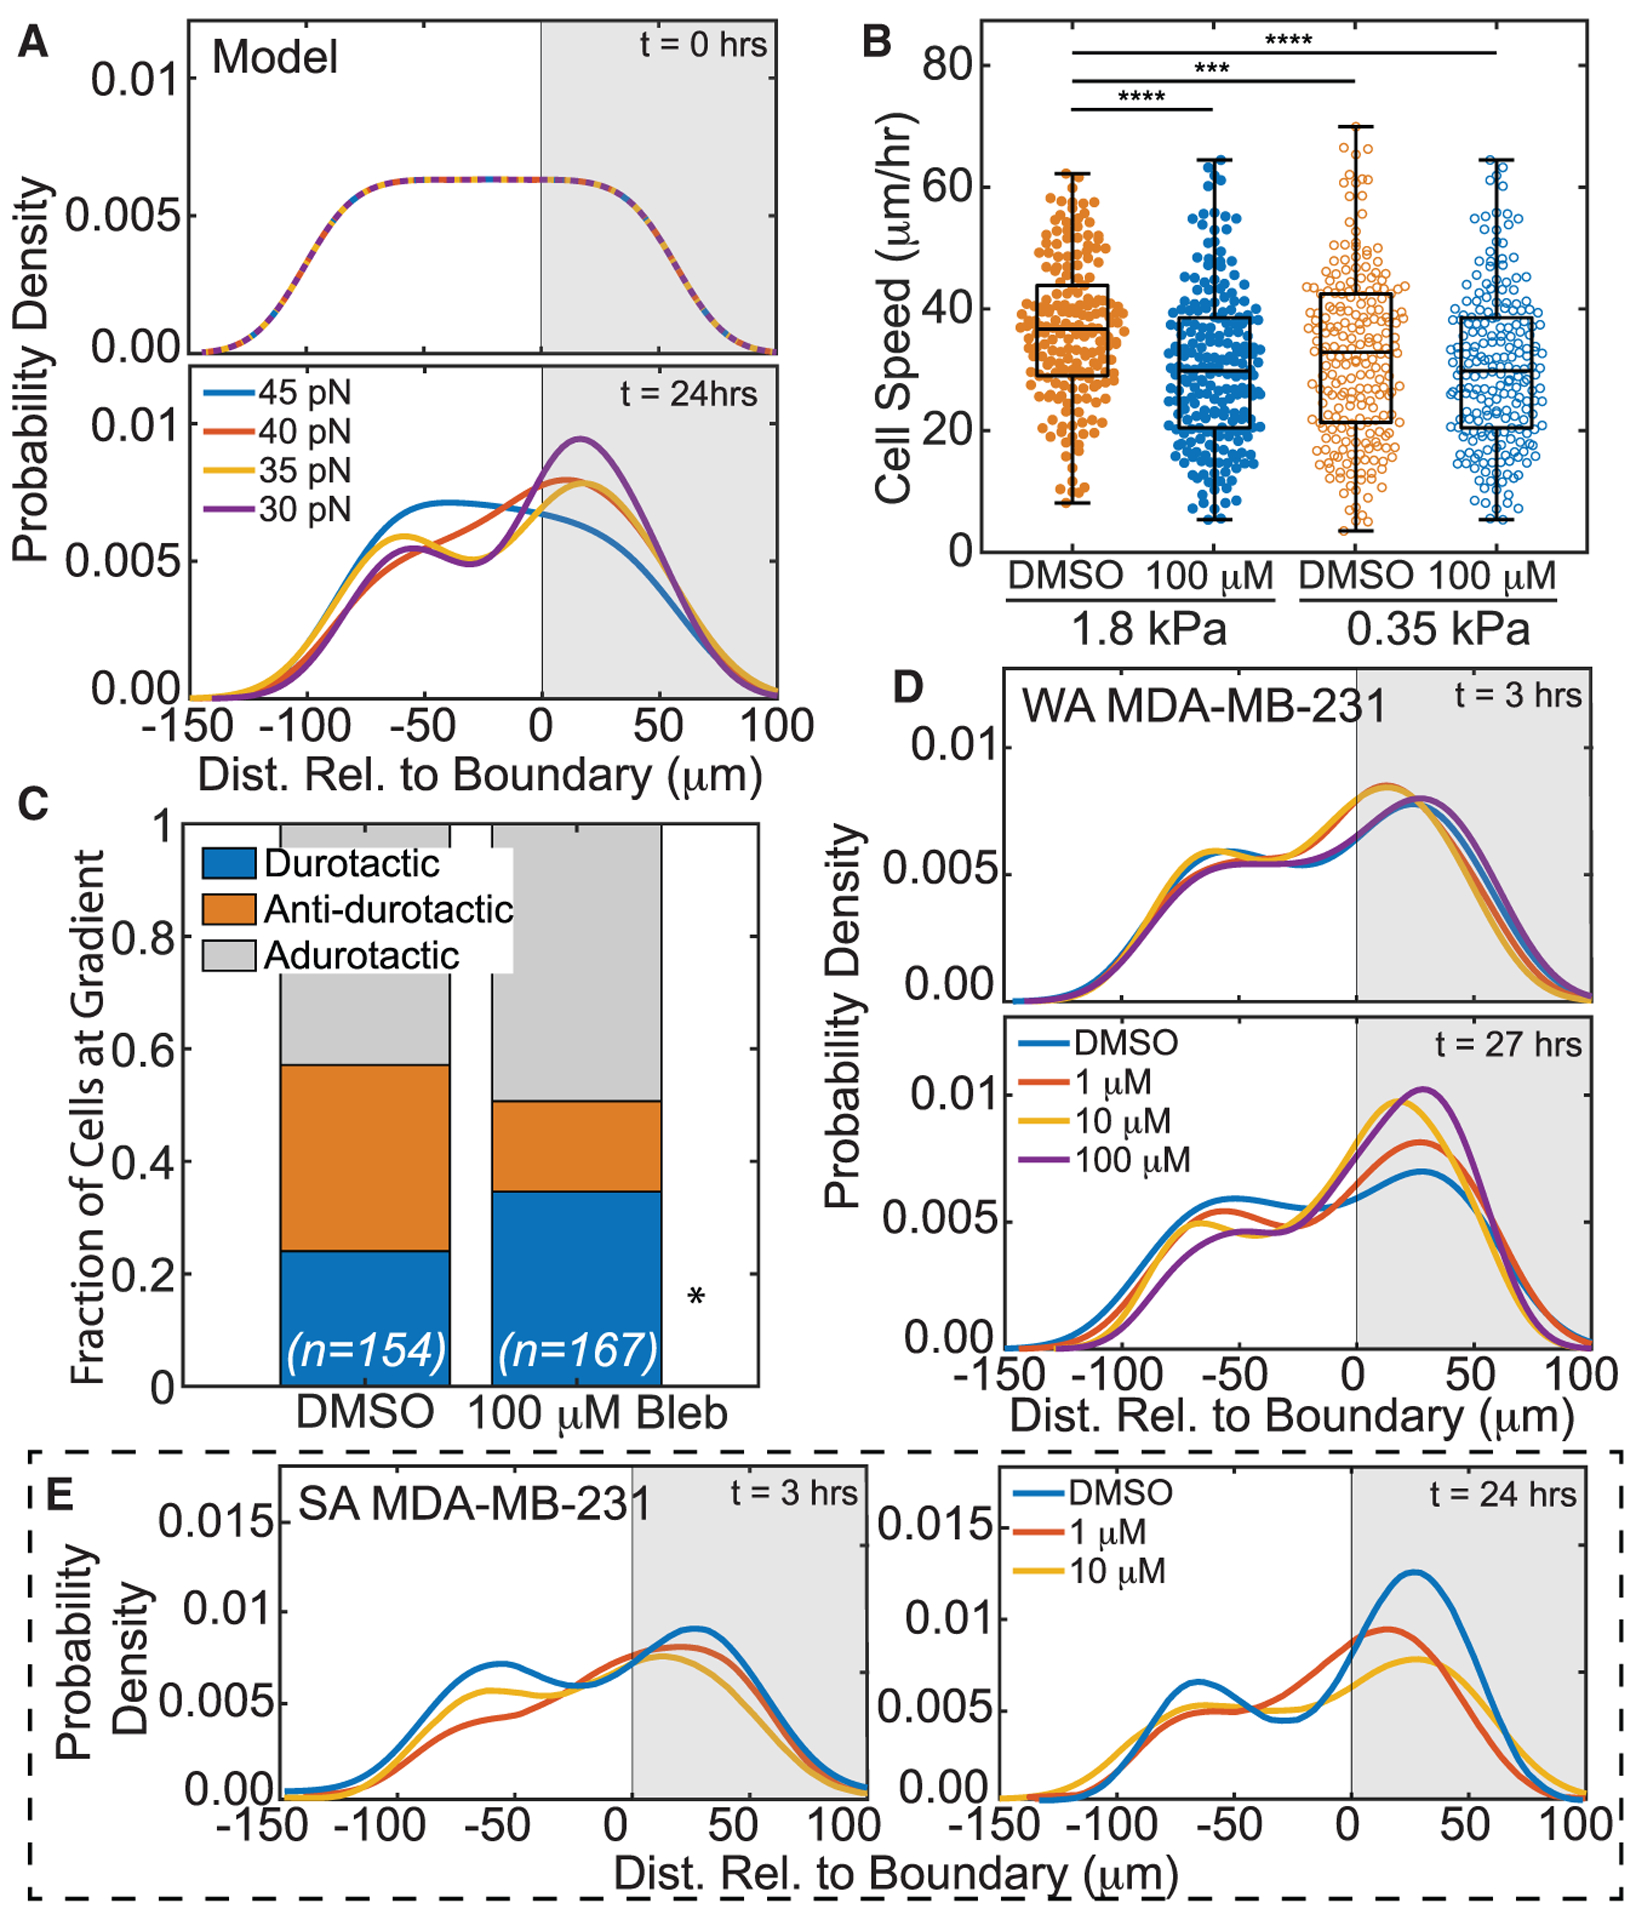
(A) Model PDF of cell distribution versus simulated hydrogel position as predicted for 30 (purple), 35 (yellow), 40 (red), and 45 pN (blue) max SF forces at t = 0 and t = 24 h. Durotactic tendency increased with decreasing max SF force.
(B) Weakly adherent MDA-MB-231 cell speed on soft or stiff side of step-gradient hydrogels for cells is plotted. Data are shown for blebbistatin-treated and nontreated cells, i.e., DMSO (orange) versus 100 μM (blue), and cells on softer (open) versus stiffer (closed) regions. (n > 245 cells for each condition from triplicate experiments). ***p < 10−3, ****p < 10−4 were determined by one-way ANOVA with Tukey test for multiple comparisons for the indicated comparisons.
(C) For treated and nontreated weakly adherent MDA-MB-231 cells that encounter the step gradient, the fraction of durotactic, anti-durotactic, and adurotactic behavior is plotted. Data represent n = 154 of 256 DMSO-treated and 167 of 245 blebbistatin-treated cells over triplicate experiments; those not counted did not interact with the gradient. Comparisons were made using a Fisher’s exact test for the same migration behavior between treated and DMSO, *p < 0.05.
(D) Weakly adherent MDA-MB-231 PDF of cell distribution was plotted versus hydrogel position for blebbistatin treatment of 100 μM (purple), 10 μM (yellow), 1 μM (red), or DMSO (blue) at t = 3 and t = 27 h.
(E) Strongly adherent MDA-MB-231 PDF of cell distribution was plotted versus hydrogel position for LPA treatment of 10 μM (yellow), 1 μM (red), or DMSO (blue) at t = 3 and t = 24 h.