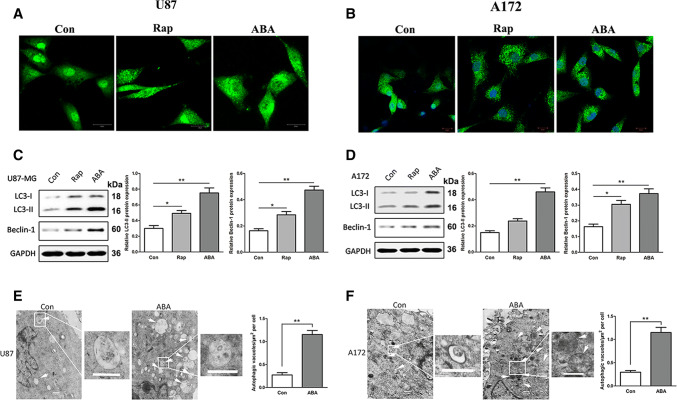
Fig. 1.
Abscisic acid inducing autophagy in glioblastoma cells. a, b Immunofluorescence with anti-LC3 antibodies showing endogenous LC3 puncta (green) in cells treated with DMSO (control), rapamycin (Rap 200 nM) and 200 μM abscisic acid (ABA) for 24 h; nuclei (blue) in U87 (a) and A172 cells (b) were visualized with DAPI. c, d Western blotting showing the endogenous conversion of LC3-I to LC3-II and the expression of beclin 1. Quantified by a densitometric analysis relative to GAPDH, the data are demonstrated on the right, n = 3. *P < 0.05 **P < 0.01 compared with controls. e, f Transmission electron microscopy (TEM) images of autophagic vacuoles in isolated cells. Autophagosomes are indicated with arrows. Regions within the boxes are magnified in the insets to indicate the double-membrane autophagosomes. Histogram values are presented as the mean ± S.E.M. in a minimum of 10 random cells. **P < 0.01 compared with controls. Scale bar, 500 nm

