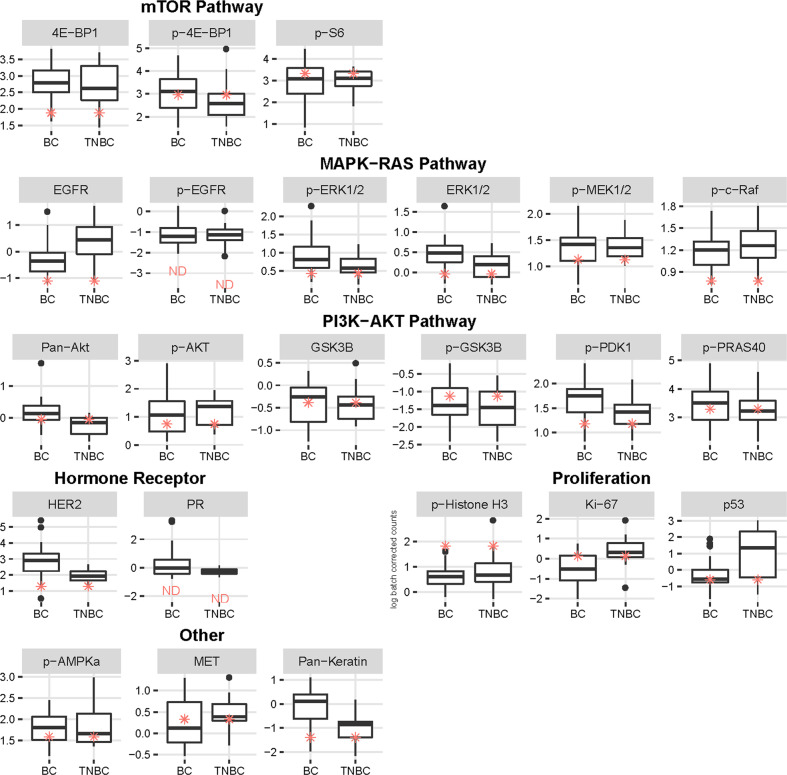
Fig. 3. Pathway analysis of protein and phosphoproteins within Study biopsy #2 by the Intracellular Signaling Protein Panel.
Box and Whisker plots Y-axis showing the distribution of antibody levels (log batch correct counts) of Study biopsy #2 (red asterisks) compared to a cohort of 32 metastatic breast cancers of all subtypes (BC) or 15 metastatic TNBC specimens, X-axis. Cohort consists of predominantly HER2 negative samples. Boxes show the 25th, 50th (median line), and 75th percentiles of the cohorts. Protein and phosphoproteins are grouped under pathways including “PI3K-AKT”, “mTOR”, and “MAPK-RAS”, and the categories “Proliferation” and “Other”. ND = Not detectable or below level of background, measured with non-specific antibody.

