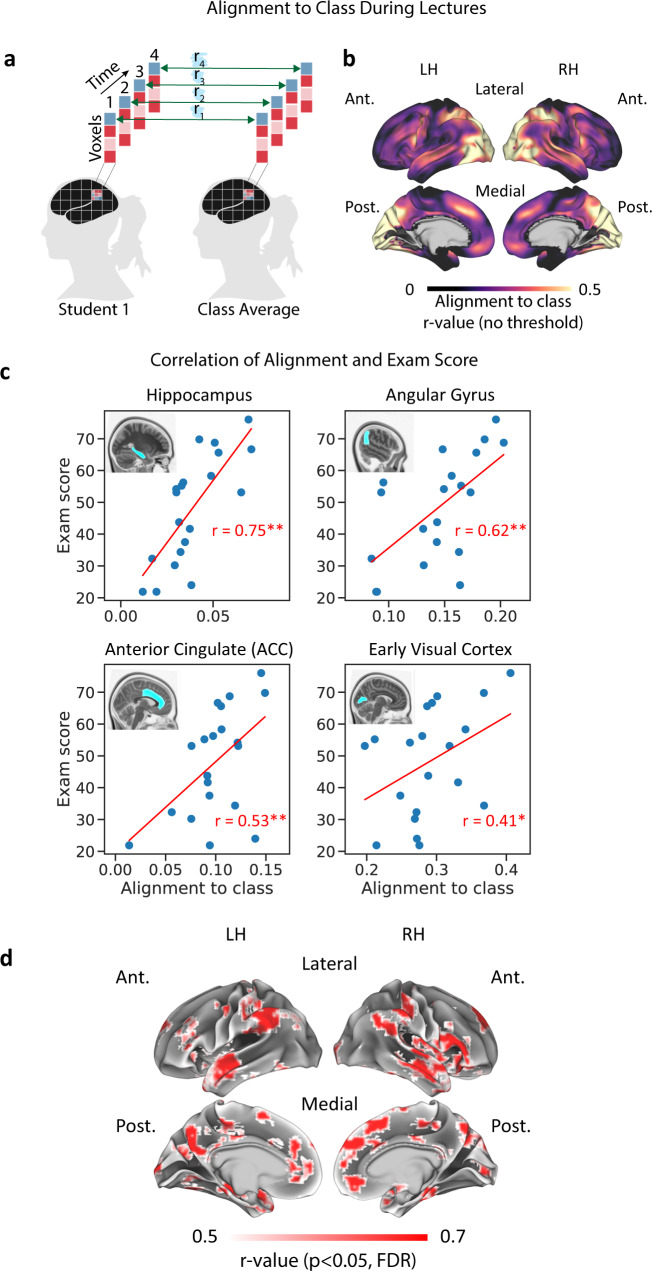
Fig. 2. Alignment-to-class during lectures predicts final exam scores.
a Calculation of alignment-to-class during lecture videos. b Alignment-to-class across the entire cerebral cortex. For demonstration purposes, this non-thresholded map shows mean alignment-to-class values across time and across students. c Prediction of exam scores from neural alignment in example ROIs. Mean alignment-to-class across lectures (x-axis) is correlated with exam scores (y-axis) using a between-participant design. Blue dots represent individual students. Asterisks denote significant correlation (one-sided permutation test, corrected), *p < 0.05, **p < 0.01. See Table 2 for a summary of ROI results. d Prediction of exam scores from neural alignment across the cortex. Searchlight analysis results shown. Voxels showing significant correlation are shown in color (one-sided permutation test, p < 0.05, corrected). LH left hemisphere, RH right hemisphere, Ant. anterior, Post. posterior.

