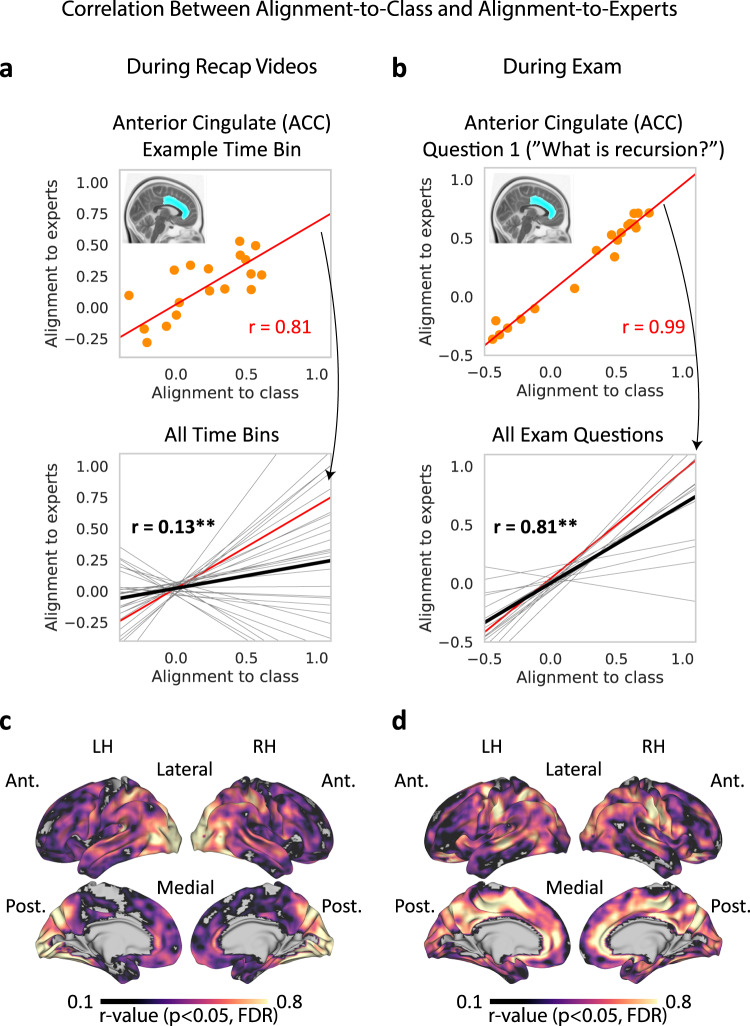
Fig. 3. Alignment-to-class and alignment-to-experts are positively correlated across the brain.
Correlation between alignment-to-class and alignment-to-expert during recap videos (left) and during final exam (right) are shown. a Between-subjects correlation during recap videos, in a single ROI. Top, correlation in a single example 30-s time bin. Orange dots represent individual students. Bottom, mean across all time bins (solid black line). Trendlines for individual time bins are shown in gray, with the example time bin shown in red. Asterisks denote significant correlation (one-sided permutation test, corrected), *p < 0.05, **p < 0.01. b Between-subjects correlation during the final exam, in a single ROI. Top, correlation during the first question. Orange dots represent individual students. Bottom, mean across all exam questions (solid black line). Trendlines for individual questions are shown in gray, with the example question shown in red. Asterisks denote significant correlation (one-sided permutation test, p < 0.01, corrected). See Table 3 for a summary of ROI analysis results. c Correlation during recap videos across the cortex, searchlight analysis results are shown. Voxels showing significant correlation are shown in color (one-sided permutation test, p < 0.05, corrected). d Correlation during the final exam across the cortex. Voxels showing significant correlation are shown in color (one-sided permutation test, p < 0.05, corrected). LH left hemisphere, RH right hemisphere, Ant. anterior, Post. posterior.

