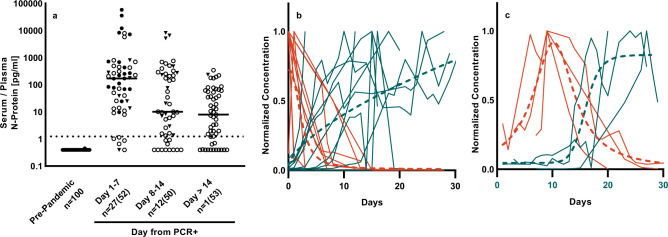
Fig. 1. Simoa SARS-CoV-2 N-protein measurements differentiate pre-pandemic from PCR+ donors.
a Shown are pre-pandemic sera and COVID-positive by molecular test (PCR+) plasma binned by day from PCR (BocaBio (triangles), U. Bonn (circles). First timepoint (closed symbol) and subsequent timepoints (open symbol) are shown. Data number is denoted as n = unique donors (total data points). Lines denote median value. b Concurrent decrease of N-protein (red) and increase of anti-SARS-CoV-2 spike IgG (blue). Time series with N-protein peak at day 1 (n = 10). c Time series with N-protein peak after day 1 (n = 3). Data were normalized to max and aligned at peak N-protein. Non-linear regression to the mean is shown in dashed lines. Non-normalized data are shown in Supplementary Fig. 2.

