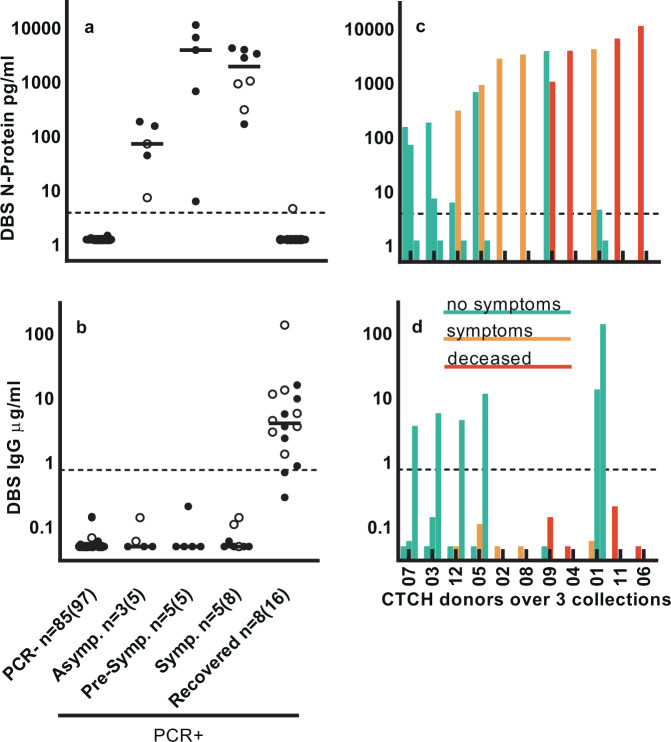
Fig. 3. SARS-CoV-2 N-protein and anti-SARS-CoV-2 IgG levels in capillary blood (DBS) correlate with symptom severity indicators.
a SARS-CoV-2 N-protein and b IgG concentrations segregated by symptom severity. First timepoint (closed symbol) and subsequent timepoints (open symbol) are shown. Data number is denoted as n = unique donors (total data points). Lines denote median value. c Ranking of donors with increasing N-protein levels, and color-coding associated with disease severity. Data are grouped by donors (n = 11), with each bar representing a single sample from 1 of the 3 collections (n = 11 sample collection 1; n = 6 sample collection 2; n = 5 sample collection 3). d IgG for same donors/collections as in c.

