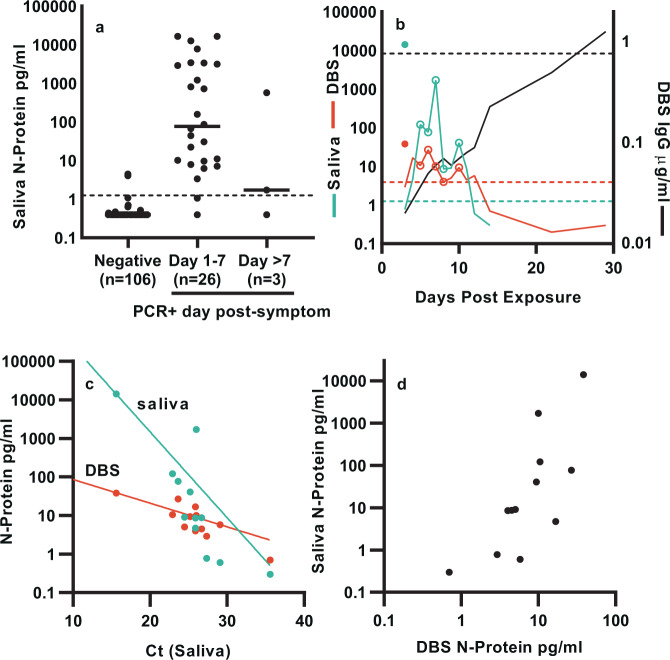
Fig. 4. SARS-CoV-2 N-protein in saliva differentiate COVID PCR− from PCR+ donors and correlate with capillary blood (DBS).
a N-protein concentration is binned by day from symptom onset. n = individual donors. b Matched saliva and DBS longitudinal samples from two donors. N-protein in saliva (blue line) and DBS (red line) and IgG in DBS (black line) for the index case (closed symbols) and housemate (lines). Open symbols represent days when symptoms are present for the housemate. c N-protein in matched saliva (blue symbols) and DBS (red symbols) as a function of cycle threshold (Ct) values, with exponential fits (solid lines). d Scatter plot of N-protein in saliva vs DBS.

