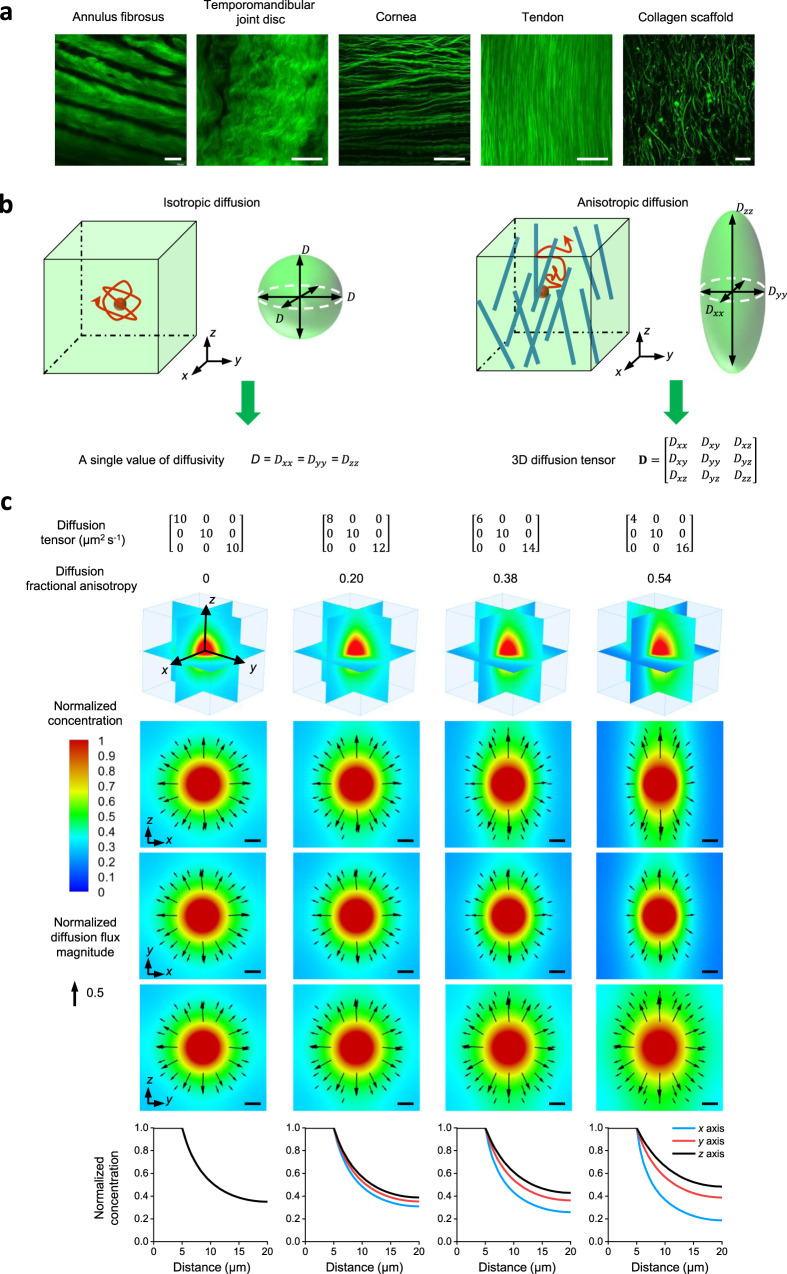
Fig. 1. 3D diffusion tensor is required to characterize anisotropic molecular diffusion in biological systems.
a Anisotropic matrix structure imaged by second-harmonic generation imaging in different biological tissues: rat annulus fibrosus, porcine temporomandibular joint disc, porcine cornea, rat tail tendon, and collagen scaffold. Experiments were repeated in at least 3 independent samples. Scale bar, 50 µm. b 3D isotropic diffusion with identical diffusivities in all directions can be characterized by a single diffusivity value. 3D anisotropic diffusion in biological systems with direction-dependent diffusivities is best described by a 3D diffusion tensor. Diffusion is considered isotropic when the diagonal components of the 3D diffusion tensor are not significantly different, and anisotropic when they are significantly different. c Computational simulation experiments of molecules diffusing out from a source center in a 3D domain demonstrate that molecular concentration distributions are regulated by 3D molecular diffusion (Supplementary Note 1). 3D anisotropic diffusion generates significantly different molecular distributions compared to isotropic diffusion. Top panel: 3D diffusion tensors with an identical average diffusivity (10 µm2 s−1) used in computational modeling and calculated diffusion fractional anisotropies used to show the extent of diffusion anisotropy. Middle panel: 3D normalized concentration distributions and 2D normalized concentration distributions and diffusion flux vectors (black arrows) in three orthogonal planes shown in the 3D plot at a time of 28 s. The concentrations were normalized to the value at the source center while the diffusion fluxes were normalized to the maximum diffusion flux magnitude among all models. Scale bar, 5 µm. Bottom panel: Normalized concentration plots along x axis (blue), y axis (red), and z axis (black) from the source center to the edge of the 3D domain at a time of 28 s. Under 3D anisotropic diffusion, concentration profiles vary among the axes, and the extent of this difference becomes greater as diffusion anisotropy increases. The simulation is for illustration purposes and is not related to the actual FRAP experiments. Source Data is available as a Source Data file for c.

