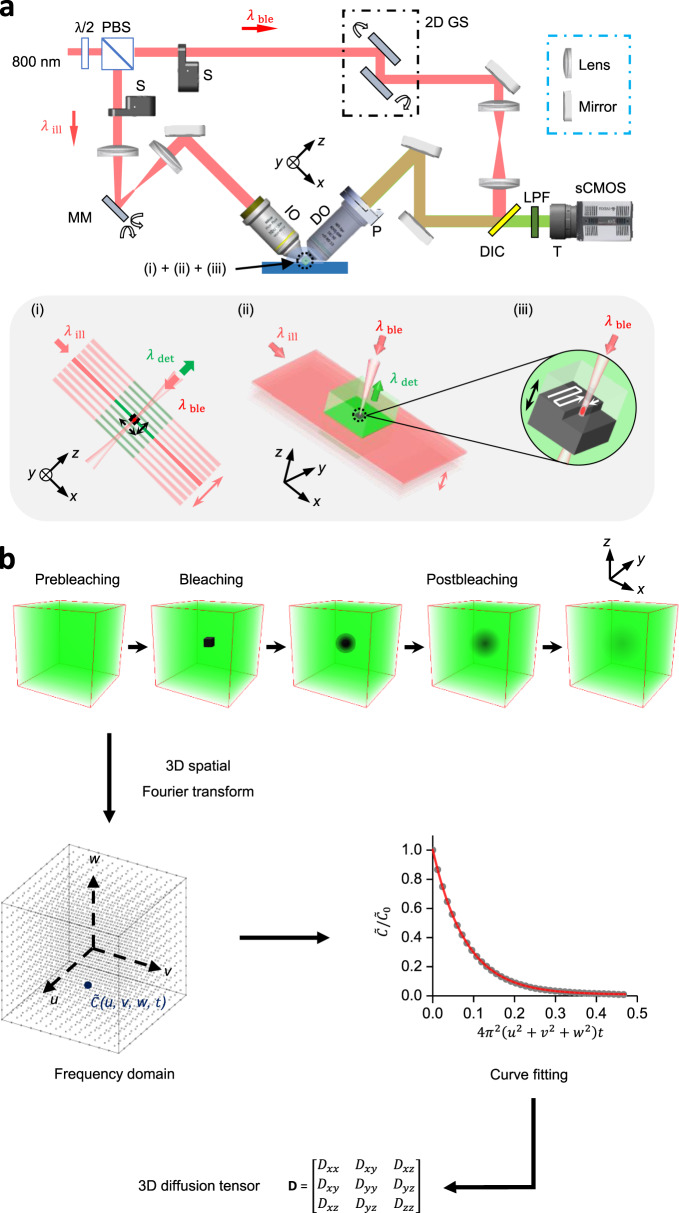
Fig. 2. LiFT-FRAP for noninvasive fast 3D diffusion tensor measurement.
a Schematic of the LiFT-FRAP system. A light sheet illuminates a thin slice of the sample and scans a 3D volume [inset (i)]. Emitted fluorescence is collected by the detection objective [inset (ii)]. A high-intensity bleaching laser creates a bleaching volume by performing 3D point-scanning at the center of the 3D illuminated volume [inset (iii)]. λ/2, half waveplate; PBS, polarizing beamsplitter; S, shutter; 2D GS, 2D galvanometer system; MM, MEMS mirror; IO, illumination objective; DO, detection objective; P, piezo stage; DIC, dichroic mirror; LPF, low-pass filter; T, tube lens; λill, illumination laser; λdet, detected emission fluorescence; λble, bleaching laser; b LiFT-FRAP data collection and analysis workflow. In a LiFT-FRAP experiment, prebleaching images are first recorded, followed by the photobleaching process. Postbleaching images are collected instantly after bleaching. Time series of 3D LiFT-FRAP image data that record the 3D fluorescence recovery process was processed and then converted to the frequency domain through a 3D spatial Fourier transformation. Based on our 3D FRAP theory (Supplementary Note 5), the normalized solute concentration in the frequency domain (gray circles) will gradually decrease with the 3D fluorescence recovery (u, v, w are the spatial frequency coordinate. The unit of u, v, w is µm−1). Fitted with the theoretical equations (red line), the diffusivity value is determined. Then each component of the 3D diffusion tensor can be calculated (Supplementary Note 5).

