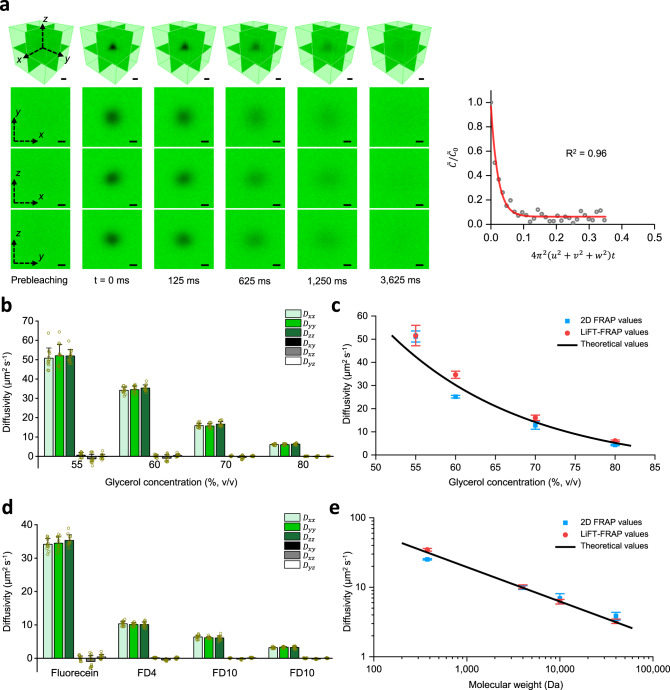
Fig. 3. Performance of LiFT-FRAP.
a Time series of LiFT-FRAP 3D images of sodium fluorescein in 55% glycerol solution and the corresponding curve fitting results. In a LiFT-FRAP experiment, prebleaching images are first recorded, followed by the photobleaching process. Then postbleaching images are collected. The 3D image acquisition rate is 8 volumes per second. is the normalized solute concentration in the frequency domain (gray circles). u, v, w are the spatial frequency coordinate. The fitted curve is shown in red. Scale bar, 10 µm. b 3D diffusion tensor results of sodium fluorescein in different glycerol solutions (n = 12 independent measurements). c Comparison of 2D FRAP results (n = 12 independent measurements), LiFT-FRAP results (n = 12 independent measurements), and theoretical results (Supplementary Table 2) for different glycerol solutions. d 3D diffusion tensor results of sodium fluorescein and FD molecules in 60% glycerol solutions (n = 12 independent measurements). e Comparison of 2D FRAP results (n = 12 independent measurements), LiFT-FRAP results (n = 12 independent measurements), and theoretical results (Supplementary Table 3) for different sized molecules. 2D FRAP and LiFT-FRAP values in c and e are the average values of the diagonal components of 2D and 3D diffusion tensor, respectively. All data depict mean ± standard deviation. Source Data is available as a Source Data file for a–e.

