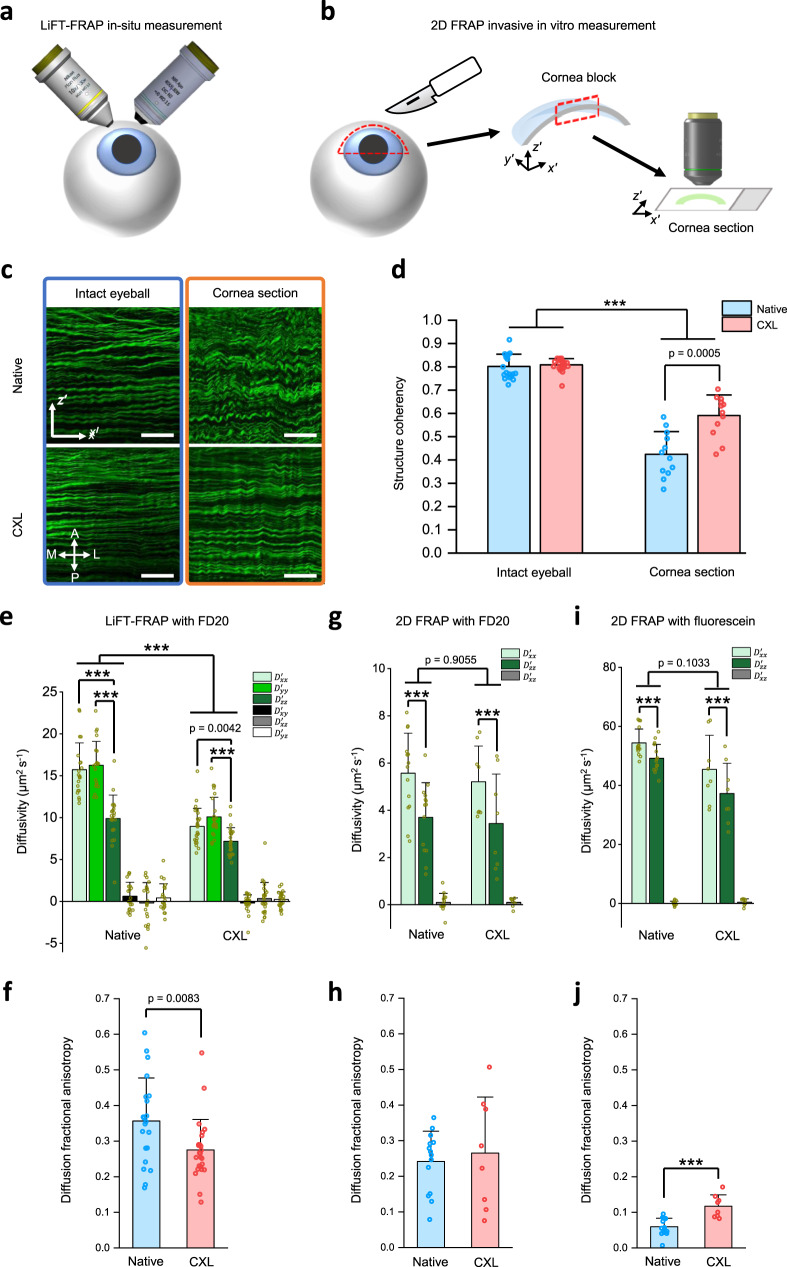
Fig. 4. Noninvasive 3D LiFT-FRAP measurement versus invasive 2D measurement in cornea tissues.
a Schematic of LiFT-FRAP in situ measurement in the cornea of porcine eyeballs. b Schematic of 2D FRAP invasive measurement in the cornea sections. Cornea tissues were first dissected from porcine eyeballs and then cut into thin sections for 2D FRAP measurement. x′–y′–z′ is the cornea coordinate system. c Representative 2D SHG images of native and CXL corneas in intact eyeballs and cornea sections. Scale bar, 50 µm. A, anterior; P, posterior; M, medial; L, lateral. d Structure coherency coefficient of collagen fiber alignment in native and CXL corneas based on their 2D SHG images (n = 19 measurements from 9 independent native eyeballs, n = 21 measurements from 10 independent CXL eyeballs; n = 12 measurements from 6 independent native sections, n = 12 measurements from 6 independent CXL sections). ***p < 0.0001, one-way ANOVA with Bonferroni post-hoc test. e 3D diffusion tensor results of FD20 in native (n = 21 measurements from 7 independent samples) and CXL (n = 25 measurements from 9 independent samples) corneas. Results are presented in the cornea coordinate system through tensor rotation (Supplementary Note 7). ***p < 0.0001, one-way and two-way ANOVA with Bonferroni post-hoc test. f 3D diffusion fractional anisotropy in native (n = 21 measurements from 7 independent samples) and CXL (n = 25 measurements from 9 independent samples) corneas. p-value was calculated with a two-sided t-test. g 2D FRAP results of FD20 in native (n = 14 measurements from 5 independent samples) and CXL (n = 8 measurements from 4 independent samples) cornea sections. ***p < 0.0001, two-way ANOVA with Bonferroni post-hoc test. h Diffusion fractional anisotropy calculated from 2D FRAP results of FD20 in cornea sections. i 2D FRAP results of sodium fluorescein in native (n = 15 measurements from 5 independent samples) and CXL (n = 8 measurements from 4 independent samples) cornea sections. ***p < 0.0001, two-way ANOVA with Bonferroni post-hoc test. j Diffusion fractional anisotropy calculated from 2D FRAP results of sodium fluorescein in native (n = 15 measurements from 5 independent samples) and CXL (n = 8 measurements from 4 independent samples) cornea sections. ***p < 0.0001, two-sided t-test. All data depict mean ± standard deviation. Source Data is available as a Source Data file for d–j.

