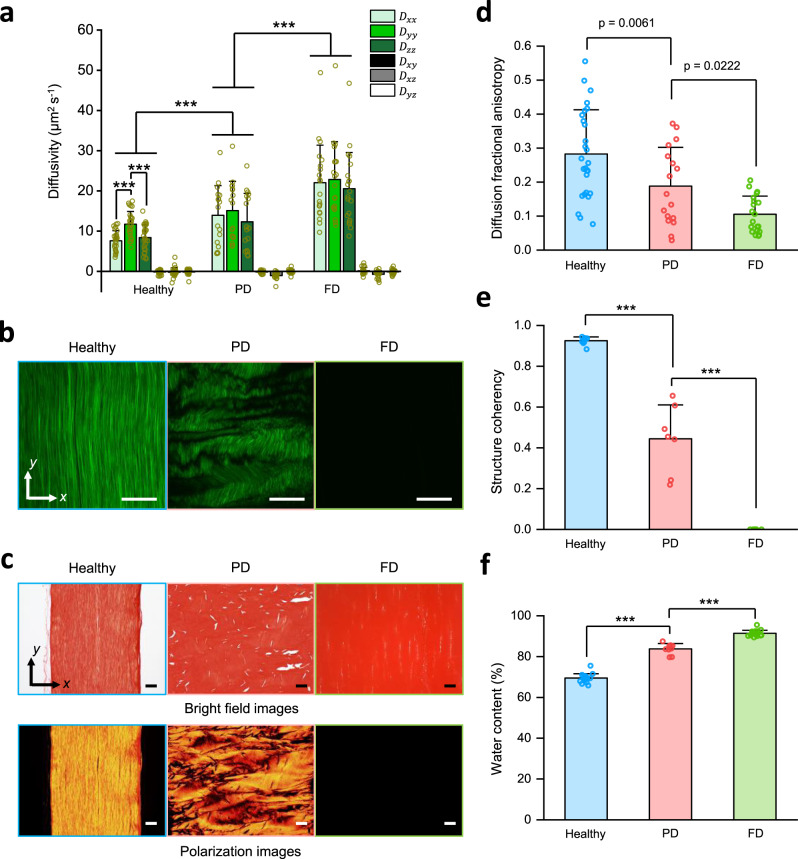
Fig. 6. Application of LiFT-FRAP in a tendon disease model.
a 3D diffusion tensor results of sodium fluorescein in healthy (n = 27 measurements from 10 independent samples), partially denatured (PD) (n = 17 measurements from 6 independent samples), and fully denatured (FD) (n = 20 measurements from 9 independent samples) tendons. ***p < 0.0001, one-way and two-way ANOVA with Bonferroni post-hoc test. b Representative SHG image of healthy, PD, and FD tendons at a depth of 150 µm beneath the tissue surface. c Representative bright field and polarization images of picrosirius red-stained sections of healthy, PD, and FD tendons. d 3D diffusion fractional anisotropy of sodium fluorescein diffusion in healthy (n = 27 measurements from 10 independent samples), PD (n = 17 measurements from 6 independent samples), and FD (n = 20 measurements from 9 independent samples) tendons. p-value was calculated with one-way ANOVA with Bonferroni post-hoc test. e Structure coherency coefficient of collagen fiber alignment in healthy (n = 9 independent samples), PD (n = 7 independent samples), and FD (n = 7 independent samples) tendons based on their SHG images. ***p < 0.0001, one-way ANOVA with Bonferroni post-hoc test. f Water content in healthy (n = 18 independent samples), PD (n = 9 independent samples), and FD (n = 17 independent samples) tendons. ***p < 0.0001, one-way ANOVA with Bonferroni post-hoc test. All data depict mean ± standard deviation. All scale bars represent 50 µm. Source Data is available as a Source Data file for a, d–f.

