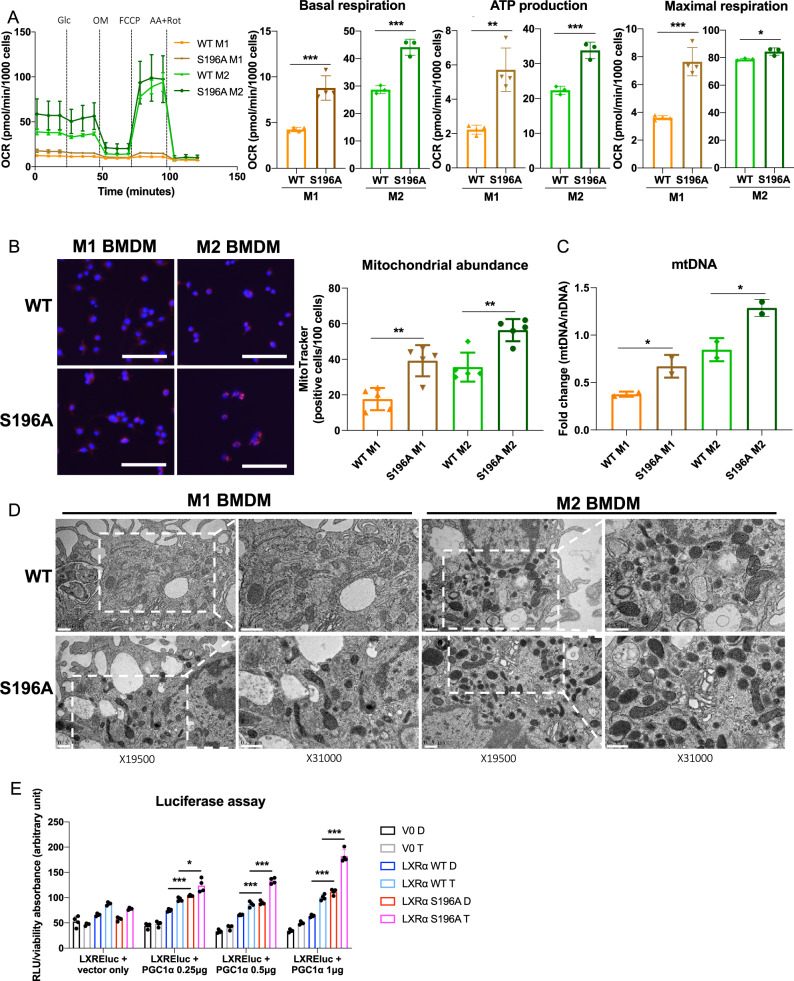
Fig. 4. LXRα S196A BMDMs increase mitochondrial abundance and activity.
Oxygen consumption rate (OCR) after sequential injection of glucose (Glc), oligomycin (OM), carbonyl cyanide 4-trifluoromethoxyphenyl hydrazine (FCCP), and antimycin plus rotenone (AA + Rot) in LXRα S196A versus WT BMDMs polarized to M1 and M2. OXPHOS parameters: basal respiration, ATP production and maximal respiration, derived from OCR values. B Cell imaging of mitochondrial abundance was visualized with MitoTracker Red CMXRos and quantified (scale bars: 100 µm). C Mitochondrial abundance in LXRα WT and S196A BMDMs determined by the expression of mitochondrial (mt) DNA normalized to nuclear (n) DNA. D Transmission electron micrographs of LXRα S196A versus WT BMDMs polarized to M1 and M2 (scale bars: 0.5 µm). Magnification at 19,500× and 31,000× is shown. E HEK293 cells stably expressing LXRα WT or LXRα S196A were transfected for 48 h with an LXRE-luciferase reporter, with either the 0.5 μg pCDNA3 vector (vector only) or with 0.25, 0.5, or 1 μg pCDNA3-PGC1α, and treated for 24 h with DMSO (D) or 5 μM T0901317 (T). Data are expressed as mean ± SD (n = 3/4 for OCR measurements, n = 5 for MitoTracker quantification, n = 2 for mtDNA measure and TEM, and n = 4 for luciferase assay,). T test; *P < 0.05, **P < 0.01, and ***P < 0.001.

